
Traderade Tool
Options Viz
See the options positioning that drives the S&P 500.
What it does
Options Viz, sold as the SPX Options Visualizer, is a live view of the options positioning and flows behind price discovery in the S&P 500 e-mini futures contract, built for traders who want context before they take a trade.
- Live dealer positioning and gamma levels for SPX and ES
- Flow that shows where price discovery is actually happening
- Works as a data add-on inside Bookmap and MotiveWave
- Streamed live in the Traderade Discord during market hours
Who it is for: Options and futures traders who trade SPX, ES and the index around the levels that matter.
How Options Viz works
The Visualizer shows SPX gamma exposure and dealer positioning as they change through the session. Roughly $1.2T in daily notional flows through SPX options across expirations, and when you trade ES futures, knowing where dealers have to hedge is most of the battle.
-
Hot calls and puts
The two most active call and put strikes by volume: where flow is concentrating right now.
-
Call and put walls
The largest call or put gamma exposure near spot. Call walls often act as resistance, put walls as support.
-
Volatility trigger
The largest gross gamma exposure just below spot. If price breaks below it, volatility tends to expand.
-
Gamma flip
The level where the market crosses from positive into negative gamma, and dealer hedging flows reverse.
-
Key levels
The next five largest levels of net gamma exposure, labeled in order. These often act as resistance.
-
Gamma levels
The next five largest levels of gross gamma exposure, labeled in order. These act like magnets, especially with large resting liquidity nearby.
Watch it a chapter at a time
The walkthrough runs 33:58. These are its own chapters, cut at the title cards, so you can watch the one you came for.
Introduction0:55
All of the Information Displayed4:43
The SPX Options Visualizer0:32
Most Active Strikes on SPX Converted to ES Levels2:09
Largest Gamma Levels4:30
Gamma Flip and What it Means3:41
Midpoint Meaning and Value4:40
The Put Wall and Vol Trigger3:59
Benefits for Traders4:17
How to Gain Access to the SPX Options Visualizer3:00
Questions, Feedback, Feature Requests1:31
About Options Viz
I'm happy to announce that my SPX Options Visualizer for Bookmap and MotiveWave is now available to the public. It ships as a data add-on for both programs, and it also runs as a stream on our Discord.
The SPX Options Visualizer provides unique insights into the positioning and flows driving market price discovery in the S&P 500 e-mini futures contract.
Buy the SPX Options Visualizer
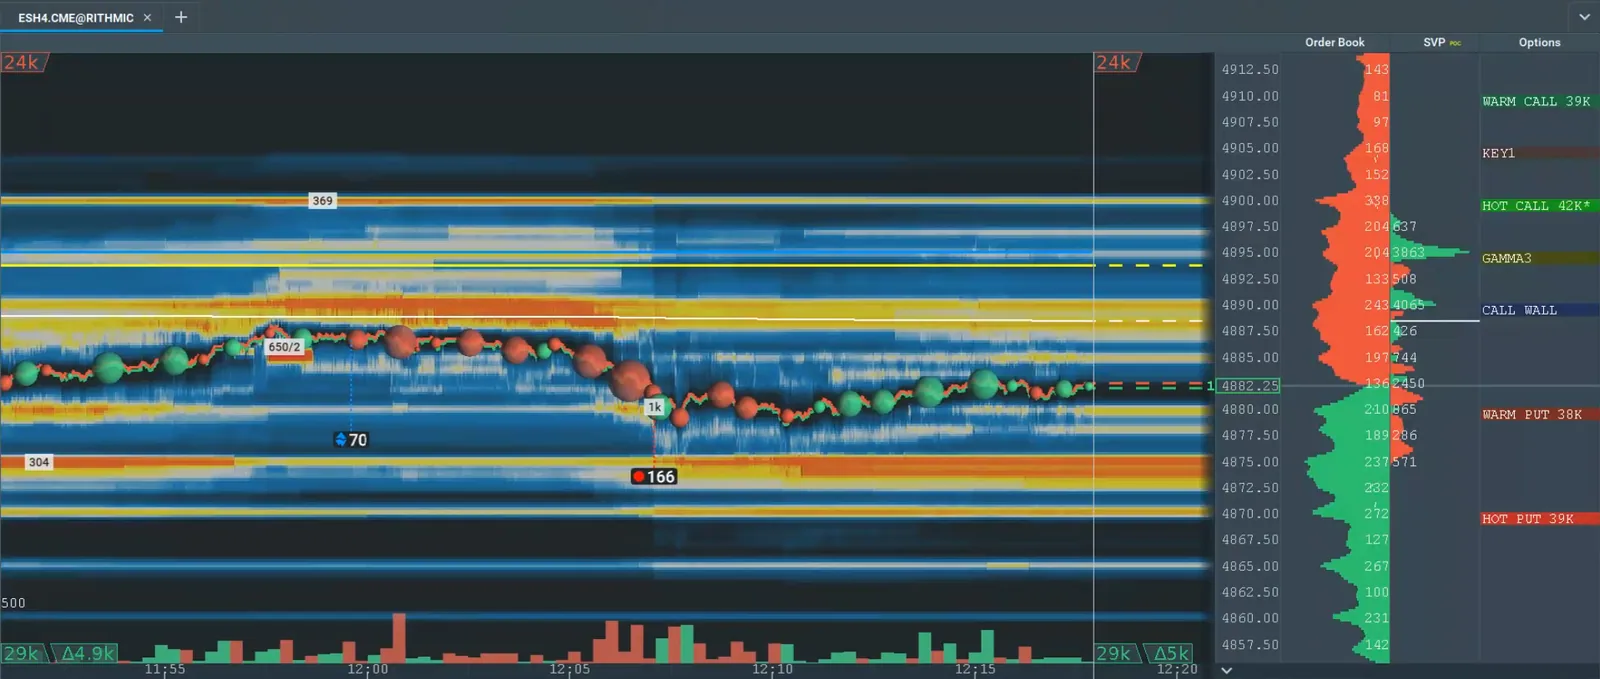
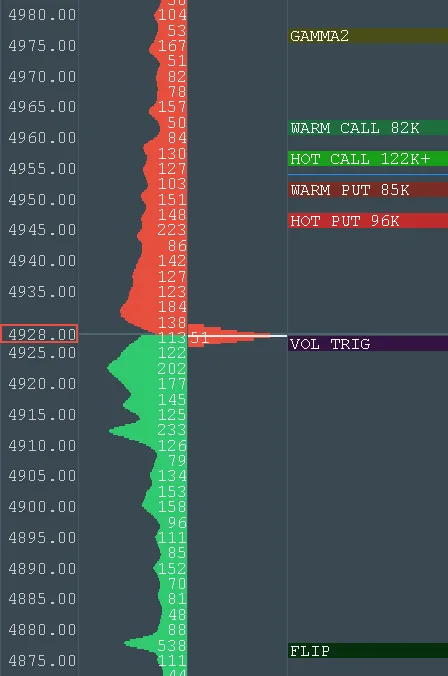
In the last several years, options have become a driving force, changing how markets trade. In particular, that's been true with the S&P 500, with the rise of index options trading and total notional daily flows of about $1.2T across all expirations. In essence, the tail now wags the dog: options notional values and volumes overwhelm those of futures.
Markets and Mayhem created this tool specifically to build a lens into SPX options positioning, or gamma exposure: the model of where dealers may have positioning, plus the prevailing volume flows of the two most active call and put strikes trading.
It is especially useful when you can identify convergences between large levels of resting liquidity (or open limit orders) and important areas of options activity and positioning, which increases confidence that these are levels to watch closely.
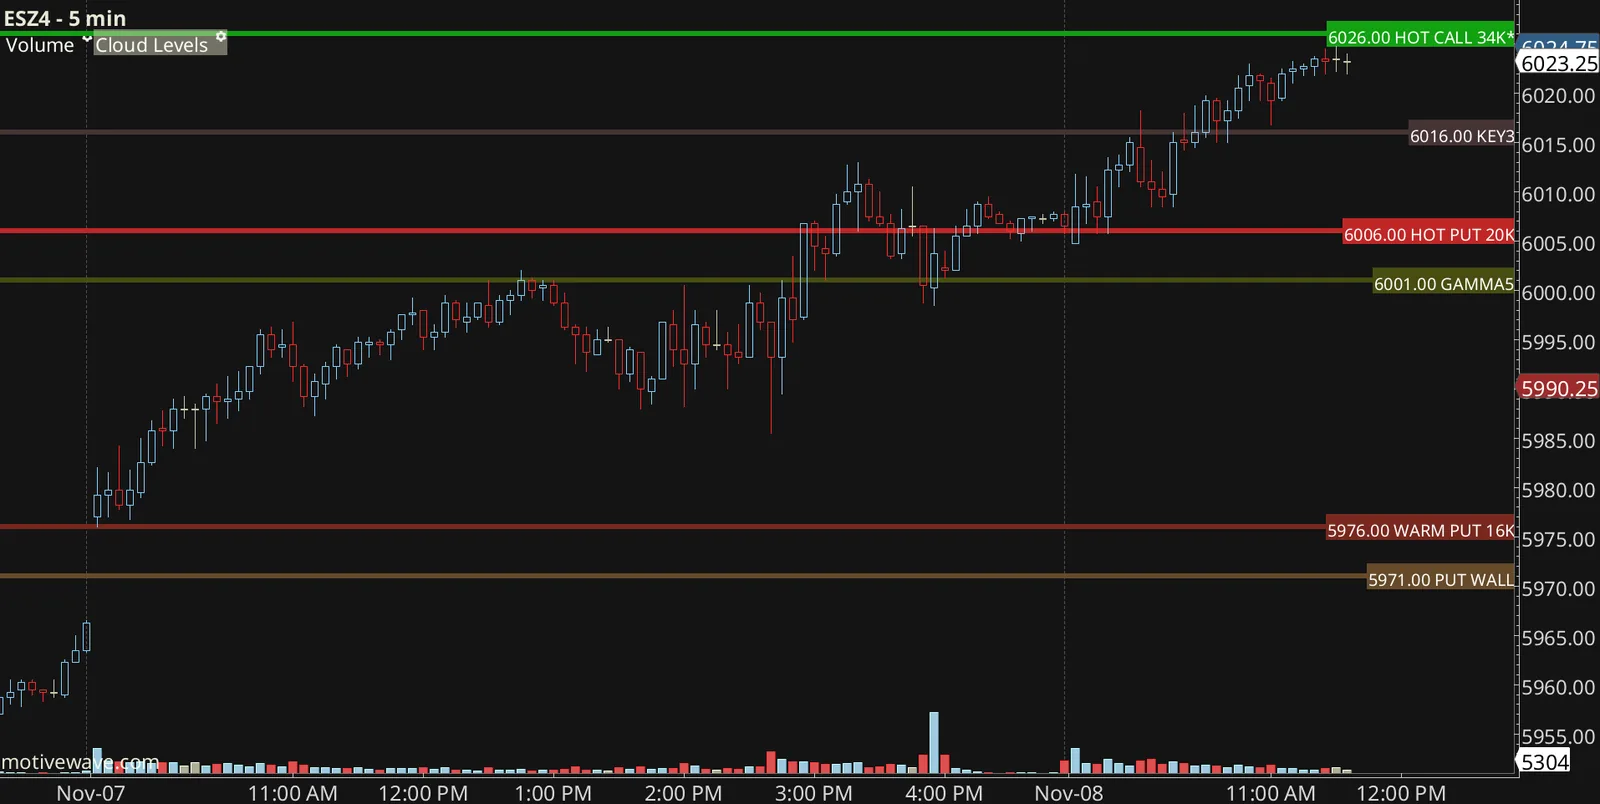
The SPX Options Visualizer was designed by a trader for other traders, with the hope of providing an edge in trading the S&P 500 e-mini futures market. It currently supports Rithmic, dxFeed and Bookmap data on Bookmap, and all CME futures data providers on MotiveWave.
Buy the SPX Options Visualizer
To learn more about the relationship between SPX options and the S&P 500 futures market, and how I trade with this information, these articles are the place to start:
- Trading with Bookmap: Coalescence as a Compass
- Quantifying the Impact of 0DTE Trading in SPX
- A new wrinkle in the SPX 0DTE saga
- SPX Gamma Exposure: Dealer Positioning and Price Impacts
- Trading Options Expiration Week Isn't Awesome
- The Basics of Options
- Understanding charm flows from the options market
If you have any questions or feedback, leave them in the Traderade Discord or contact us.
What Members Say
Frequently Asked
What is Options Viz?
Options Viz, sold as the SPX Options Visualizer, is a live view of the options positioning and flows behind price discovery in the S&P 500 e-mini futures contract, built for traders who want context before they take a trade.
How do I get access?
It runs live in the Traderade Discord. The Bookmap and MotiveWave data add-ons are available to traders who already run those platforms.
Which markets does it cover?
SPX and the S&P 500 e-mini futures (ES), with NQ covered on the futures tools.
Do I need Bookmap to use it?
No. The Discord stream works in the browser. The add-on is for traders who already run Bookmap or MotiveWave.
Get access to Options Viz
Streamed live in the Traderade Discord, alongside the rest of the tools and the educational sessions.