The Psychology Behind Moving Averages
Moving averages (MAs) are an essential technical analysis tool in the world of trading and investing, particularly for stock market participants. They represent a widely...
An indicator is arithmetic applied to price and volume. It does not see the future and it does not know anything the chart does not already contain - it rearranges what is there so a specific question is easier to answer.
That is the whole point. Used that way, a small number of indicators is enough. Used as a signal generator, more of them just produce more contradictory answers.
The useful framing is not which indicator is best, it is what question you are asking. Trend, momentum, volatility and participation are four different questions, and one indicator from each is a complete toolkit.
Trend: is the instrument going somewhere, and in which direction. Momentum: is the move accelerating or fading. Volatility: how far does it normally travel, which sets your stop and your size. Participation: is volume confirming the move.
Stacking three momentum oscillators answers the same question three times and adds nothing but disagreement.
A moving average is the average price over a window, plotted continuously. Its value is not that it predicts anything, it is that it turns a noisy series into a readable direction and gives you an objective line to measure pullbacks against.
The window is a trade-off, not a setting to optimise. Shorter responds faster and whipsaws more; longer is steadier and later. The failure mode to know is the range: when price chops sideways, averages cross repeatedly and every crossover looks like a signal and is not one. Our archive covers the behaviour in The Psychology Behind Moving Averages.
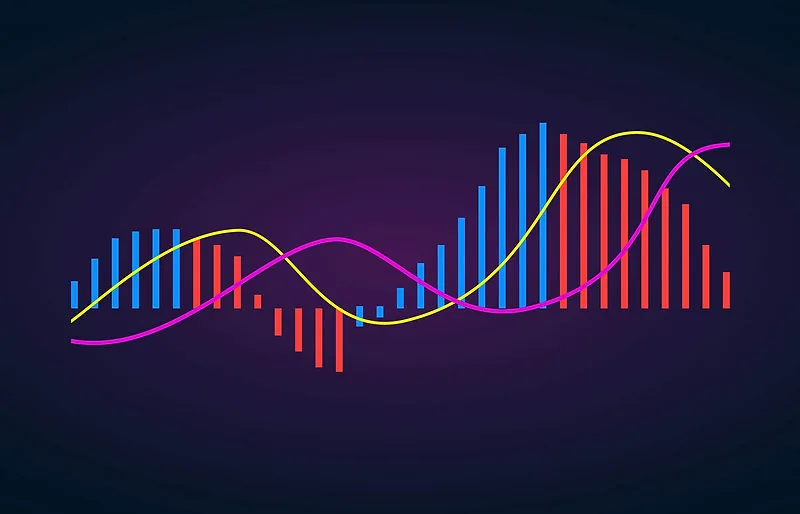
Momentum measures the rate of change rather than the level. MACD compares two moving averages and plots the difference with a signal line, so it is really a trend-following tool wearing a momentum label. RSI compares average gains to average losses over a window and compresses that into a bounded scale.
Both are most useful for divergence and for reading whether a move is strengthening or tiring, and least useful as a standalone buy or sell trigger. A market can stay overbought far longer than an oscillator implies. See Using the MACD Indicator.
Bollinger Bands plot a moving average with bands a set number of standard deviations either side, so they widen when the market is volatile and narrow when it is quiet. The narrow phase is the interesting one, because compression tends to resolve into expansion. Our archive covers the pattern in Bollinger Band Squeeze Breakouts.
Average true range does something simpler and more practical: it tells you the typical distance the instrument travels per bar. That number is what a stop distance and a position size should be derived from, which is why ATR belongs in every swing trader's toolkit even though it generates no signals at all.
Volume answers whether a move had participation. A breakout on heavy volume is a different event from the same breakout on light volume, and the difference is usually more informative than any oscillator reading.
Order flow goes a level deeper, into where liquidity actually sits. Volume profile shows how much traded at each price rather than when; delta shows the balance of aggressive buying and selling. Both are the basis of the in-house tools - Exhaustion Indicator reads when one side has overcommitted, and Dynamic Pivots derives support and resistance from volume rather than a fixed session grid.
The more you tune an indicator's settings against past data, the better it fits that data and the less it says about anything else. A window chosen because it produced the best historical result on one instrument is usually curve fitting, not discovery.
The test is whether the parameter makes sense as a round number chosen for a reason, and whether the behaviour holds on instruments you did not tune it on. Our archive covers the failure mode in The Perils of Curve Fitting.
One per question rather than several of the same kind: a trend measure such as a moving average, a momentum measure, a volatility measure for sizing, and volume for confirmation.
Few. Each indicator that asks the same question as another adds disagreement rather than information.
Round numbers chosen for a reason. Settings tuned to maximise a backtest on one instrument are usually curve fitting and rarely survive live.
They describe price and volume accurately and predict nothing. They are useful for framing a decision and useless as a guarantee.
It measures how far the instrument typically travels per bar, which is what a stop distance and therefore a position size should be derived from.
Moving averages (MAs) are an essential technical analysis tool in the world of trading and investing, particularly for stock market participants. They represent a widely...
The Moving Average Convergence Divergence (MACD) is a widely recognized technical analysis tool used in trading to identify potential trend reversals, generate buy and...
Bollinger Bands are a widely used technical analysis tool that was developed by John Bollinger in the 1980s. They are plotted two standard deviations away from a moving...
Donchian Channels, developed by Richard Donchian in the 1950s, are a useful technical analysis tool used in trading to identify market trends, potential breakouts, and...
The Ichimoku Cloud, also known as Ichimoku Kinko Hyo, is a versatile technical analysis tool that has gained significant attention in various financial markets. This...
The Stochastic Oscillator, a powerful tool in technical analysis, was developed by George C. Lane in the late 1950s. It's designed to interpret price momentum and...
Trade ideas, cutting edge indicators, live futures streams, real-time market news and a community of traders who share what they learn.