The Psychology Behind Moving Averages
Moving averages (MAs) are an essential technical analysis tool in the world of trading and investing, particularly for stock market participants. They represent a widely...
Topic
Technical analysis from first principles: what each measure is actually computed from, what question it answers, and where it stops being useful.
Technical analysis from first principles: what each measure is actually computed from, what question it answers, and where it stops being useful.
Indicators are arithmetic on price and volume, not forecasts. The swing trading indicators guide explains how to pick a small set that answers different questions.
Moving averages (MAs) are an essential technical analysis tool in the world of trading and investing, particularly for stock market participants. They represent a widely...
The Bollinger Band Squeeze and Breakout is a momentum-driven strategy that's worth studying, particularly for its ability to identify potential shifts in market...
The Stochastic Oscillator, a powerful tool in technical analysis, was developed by George C. Lane in the late 1950s. It's designed to interpret price momentum and...
Donchian Channels, developed by Richard Donchian in the 1950s, are a useful technical analysis tool used in trading to identify market trends, potential breakouts, and...
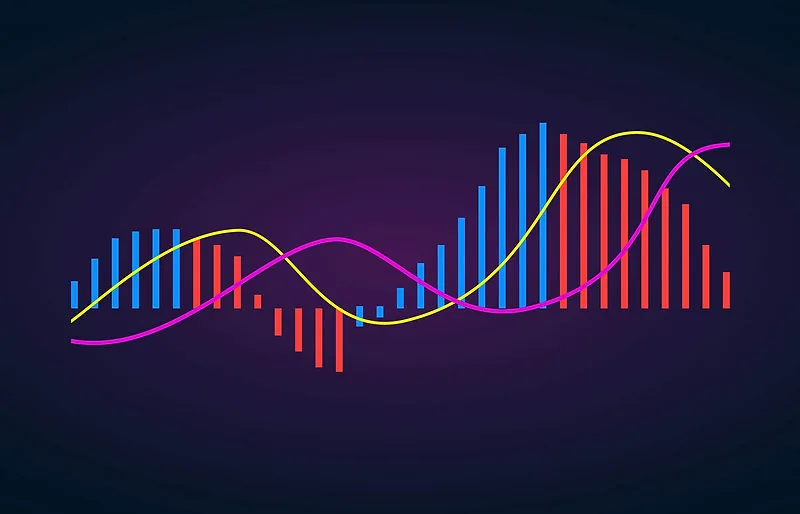
The Moving Average Convergence Divergence (MACD) is a widely recognized technical analysis tool used in trading to identify potential trend reversals, generate buy and...
The Ichimoku Cloud, also known as Ichimoku Kinko Hyo, is a versatile technical analysis tool that has gained significant attention in various financial markets. This...
Ever heard the phrase "Don't try to catch a falling knife"? Catching a falling knife is a metaphor used in the stock market to describe the act of buying a stock that is...
In the world of trading, one of the most critical elements is risk management. Experienced traders understand that it is not just about making profits, but also about...
Bollinger Bands are a widely used technical analysis tool that was developed by John Bollinger in the 1980s. They are plotted two standard deviations away from a moving...
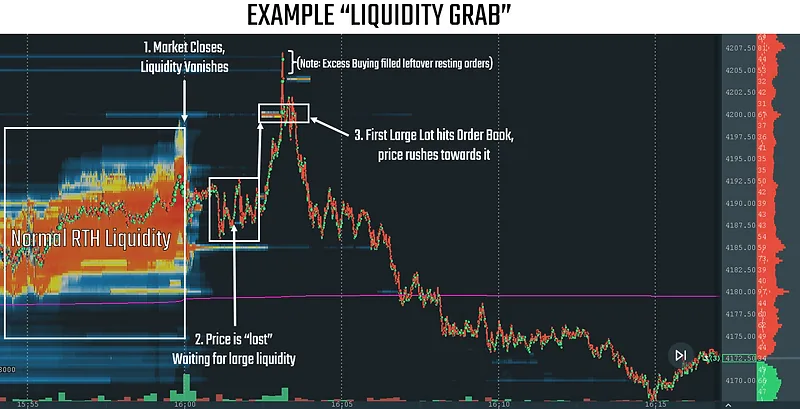
In our Traderade Discord today, I used the term "Liquidity Grab" to describe a unique market phenomenon that I look for when trading special events, such as FOMC or...
I love trading indicators. I enjoy coding my own and learning from other coders about strategies they are working on systematizing. Over the past few years I've been...
Trade ideas, cutting edge indicators, live futures streams, real-time market news and a community of traders who share what they learn.