
_edited.png)
Understanding the Ichimoku Cloud
- Dec 18, 2023
- 4 min read
The Ichimoku Cloud, also known as Ichimoku Kinko Hyo, is a versatile technical analysis tool that has gained significant attention in various financial markets. This article delves into the history of the Ichimoku Cloud, its usage across different asset classes, its evolution by its author, and its current status as an eclectic but increasingly popular charting indicator.
History of the Ichimoku Cloud
Origins
The Ichimoku Cloud was developed by a Japanese journalist named Goichi Hosoda in the late 1930s. Hosoda, known by his pen name Ichimoku Sanjin, spent over 30 years perfecting this technique before releasing it to the public in his 1968 book.
The indicator was designed to provide a comprehensive view of the market's price action at a glance, combining multiple chart elements to offer insights into market trends, support and resistance levels, and momentum.
Significance in Japanese Market Analysis
Initially, the Ichimoku Cloud was predominantly used in the Japanese stock markets. It was a closely guarded secret among Japanese traders until it started gaining international attention in the 1990s. Its appeal in Japan was largely due to its ability to provide a detailed yet straightforward visual representation of the market dynamics.
Learn more about the Ichimoku Cloud in the latest Traderade Podcast below, hosted by Apple.
Or keep reading as we go through more detail below!
The Five Main Components of the Ichimoku Cloud
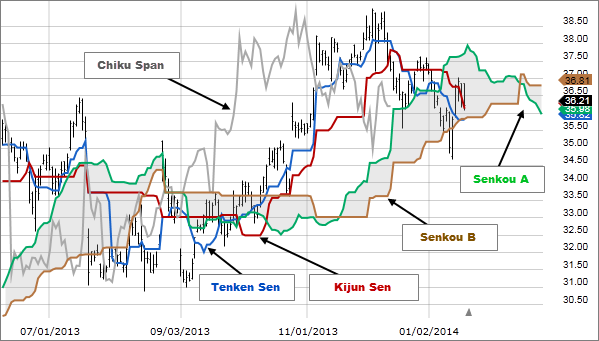
Tenkan-sen (Conversion Line): This line is calculated by averaging the highest high and the lowest low over the last 9 periods. It represents a short-term trend indicator and is more reactive to price changes compared to the Kijun-sen.
Kijun-sen (Base Line): Similar to the Tenkan-sen, the Kijun-sen is calculated by averaging the highest high and the lowest low, but over the past 26 periods. It offers a longer-term trend perspective and can act as a support or resistance level.
Senkou Span A (Leading Span A): This is the average of the Tenkan-sen and the Kijun-sen plotted 26 periods ahead. It forms one of the boundaries of the Ichimoku Cloud and is key in determining future areas of support and resistance.
Senkou Span B (Leading Span B): Calculated by averaging the highest high and the lowest low over the past 52 periods and plotted 26 periods ahead, this line forms the other boundary of the Ichimoku Cloud. The space between the Senkou Span A and B is the cloud itself.
Chikou Span (Lagging Span): This line represents the closing price plotted 26 periods behind. It helps to confirm the trend direction and can signal potential trend reversals.
Interpreting the Ichimoku Cloud Indicators
Cloud (Kumo) Thickness: The cloud's thickness indicates the strength of the support or resistance. A thicker cloud suggests stronger support/resistance, making it harder for the price to break through.
Cloud Color Change: A change in the color of the cloud (from red to green or vice versa) can signal a potential trend reversal. Green indicates bullish sentiment, while red indicates bearish sentiment.
Price Relative to Cloud: If the price is above the cloud, it indicates a bullish trend. Conversely, if it is below the cloud, it suggests a bearish trend. The cloud itself acts as support in an uptrend and resistance in a downtrend.
Tenkan-sen and Kijun-sen Crossover: Known as the 'TK Cross', a crossover of these lines can signal a potential change in the trend. A bullish signal is given when the Tenkan-sen crosses above the Kijun-sen, and a bearish signal when it crosses below.
Chikou Span Position: If the Chikou Span is above the price, it suggests bullish sentiment. If it is below the price, it indicates bearish sentiment. Its position relative to past prices can also confirm the strength of the trend.
Trading Strategies Using Ichimoku Cloud
Cloud Breakouts: Traders often look for price breakouts from the cloud. A breakout above the cloud signals bullish momentum, while a breakout below signals bearish momentum.
Support and Resistance: The cloud, along with the Kijun-sen, provides dynamic support and resistance levels. These can be used to set stop-loss orders or to identify potential entry and exit points.
Confirming Signals: The Ichimoku Cloud is most effective when its signals are confirmed by other indicators or market conditions. For example, a bullish TK Cross accompanied by a price above the cloud is a stronger signal than a TK Cross alone.
Evolution Over Time
Development by Goichi Hosoda
Goichi Hosoda spent many years refining the Ichimoku Cloud, testing different time periods and components to suit the Japanese market's needs. The original formulation was tailored to the daily time frame, which was the standard for Japanese traders at the time.
Adaptation to Different Markets and Time Frames
As the Ichimoku Cloud gained popularity in the West, traders began adapting it to different markets and time frames, including forex and commodities. Other methodologies for calculating the cloud evolved as well, including the volume-weighted cloud.
Current Status as a Charting Indicator
Integration in Technical Analysis Platforms
Today, the Ichimoku Cloud is a standard feature in most technical analysis software and trading platforms. Its ability to provide a multi-dimensional view of the market makes it a favorite among traders of all levels.
Increasing Popularity
Although it is considered more complex than basic technical indicators like moving averages, the Ichimoku Cloud's comprehensive nature has contributed to its growing popularity. Its ability to offer a holistic view of the market makes it a valuable tool for traders seeking to enhance their technical analysis strategies.
Closing Thoughts
The Ichimoku Cloud stands out as a unique and comprehensive tool in the study of technical analysis.
From its origins in Japan to its widespread adoption across various global markets, the Ichimoku Cloud continues to evolve and adapt, offering traders a powerful instrument to decipher market trends and make informed trading decisions.
We continue to use the Ichimoku Cloud here at Traderade as we find it still has value in our technical analysis within a variety of asset classes.


Comments