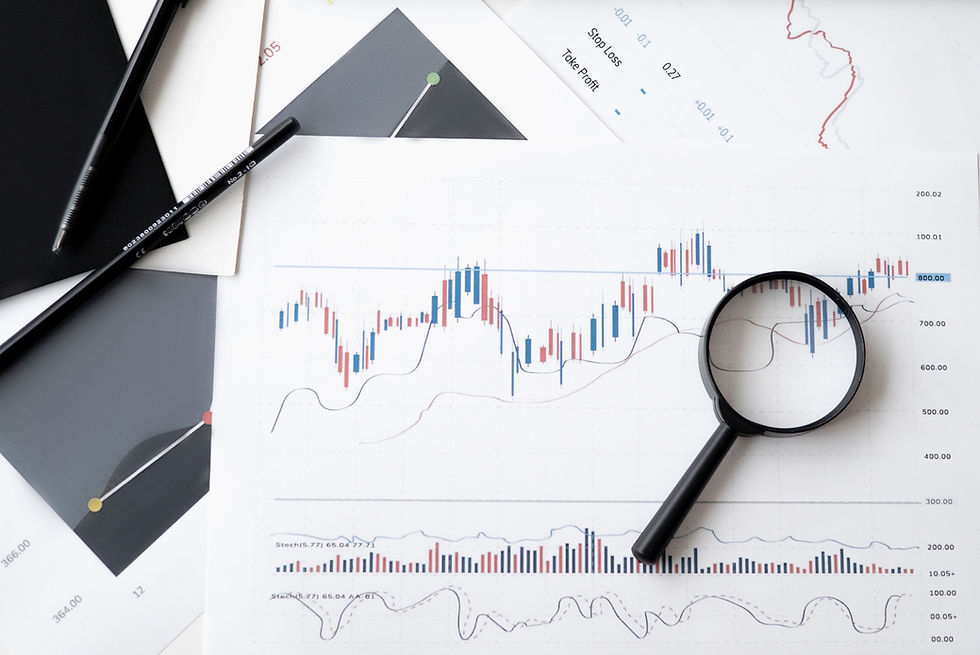
Measuring Volatility in Trading: Why & How
- Markets & Mayhem

- Feb 5, 2024
- 3 min read
One of the most important lessons I've learned as a trader is that understanding and measuring volatility is crucial to success.
My own goal as a trader is to try to ensure that no single trade leads to more than a 1% total drawdown of my trading portfolio. As a result, knowing the volatility of what I am trading helps me to plan for my stops and position sizing.
In this article, we will explore various methods for measuring volatility, including implied and realized volatility, Bollinger bands, average true range, and beta.
Implied Volatility: A Glimpse into the Future
Implied volatility is a forward-looking measure of the expected volatility of an asset's price over a specific period. It is derived from options pricing models, such as the Black-Scholes model, which take into account factors like the current price of an option, its strike price, time to expiration, and interest rates.
The main advantage of implied volatility is that it reflects the market's collective expectations about future price movements. However, it should be noted that implied volatility can sometimes deviate significantly from realized volatility, which is a backward-looking measure.
Realized Volatility: A Rearview Mirror View
In contrast to implied volatility, realized volatility measures past price movements over a specified period. It provides a historical perspective on an asset's price fluctuations and helps traders gauge the actual level of market turbulence. Some common methods for calculating realized volatility include using the standard deviation of log returns or the average true range (ATR).
Bollinger Bands: A Visual Guide to Volatility
Bollinger bands are a popular technical analysis tool that helps traders visualize an asset's volatility over time. The bands consist of three lines – a moving average and two standard deviations above and below the moving average, all plotted on a chart. When the price is close to the middle band, the market is considered less volatile, while a significant distance from the bands indicates higher volatility.
Traders can use Bollinger bands to identify periods of low or high volatility and potential breakout opportunities. For example, when the price moves outside the bands after a squeeze, it may signal an impending strong trend in either direction.
Average True Range: A Wider Look at Volatility
The average true range (ATR) is another useful tool for measuring volatility, which considers both price changes and gaps. It is calculated by taking the average of the absolute values of the high-low range, the high-close range, and the low-close range over a specified period. A higher ATR indicates increased market volatility, while a lower ATR suggests a more stable market environment.
Beta: Measuring an Asset's Volatility Relative to a Benchmark
Beta is a measure of an asset's price volatility relative to a benchmark, such as a stock market index or another asset. It helps traders understand how an asset's price is likely to react to changes in the benchmark's price. A beta of 1 indicates that an asset's price moves in line with the benchmark, while a beta greater than 1 suggests that the asset is more volatile and reacts more strongly to market fluctuations. Conversely, a beta less than 1 implies that the asset is less volatile and reacts less dramatically to market changes.
In Closing
Understanding and measuring volatility is vital for successful trading. By incorporating some of these methods, such as implied and realized volatility, Bollinger bands, average true range, and beta into your analysis, you can gain a comprehensive view of market conditions and make more informed decisions about risk management and position sizing.
Remember that no single method is perfect, so consider a combination of volatility measurements and the idea of backtesting which one(s) work best with the instrument you are trading.

.png)


Comments