
In-house bot
Gir
The options market, rendered.
Original visuals. Every chart on this page is rendered by Gir from options and market data. No third-party chart screenshots.
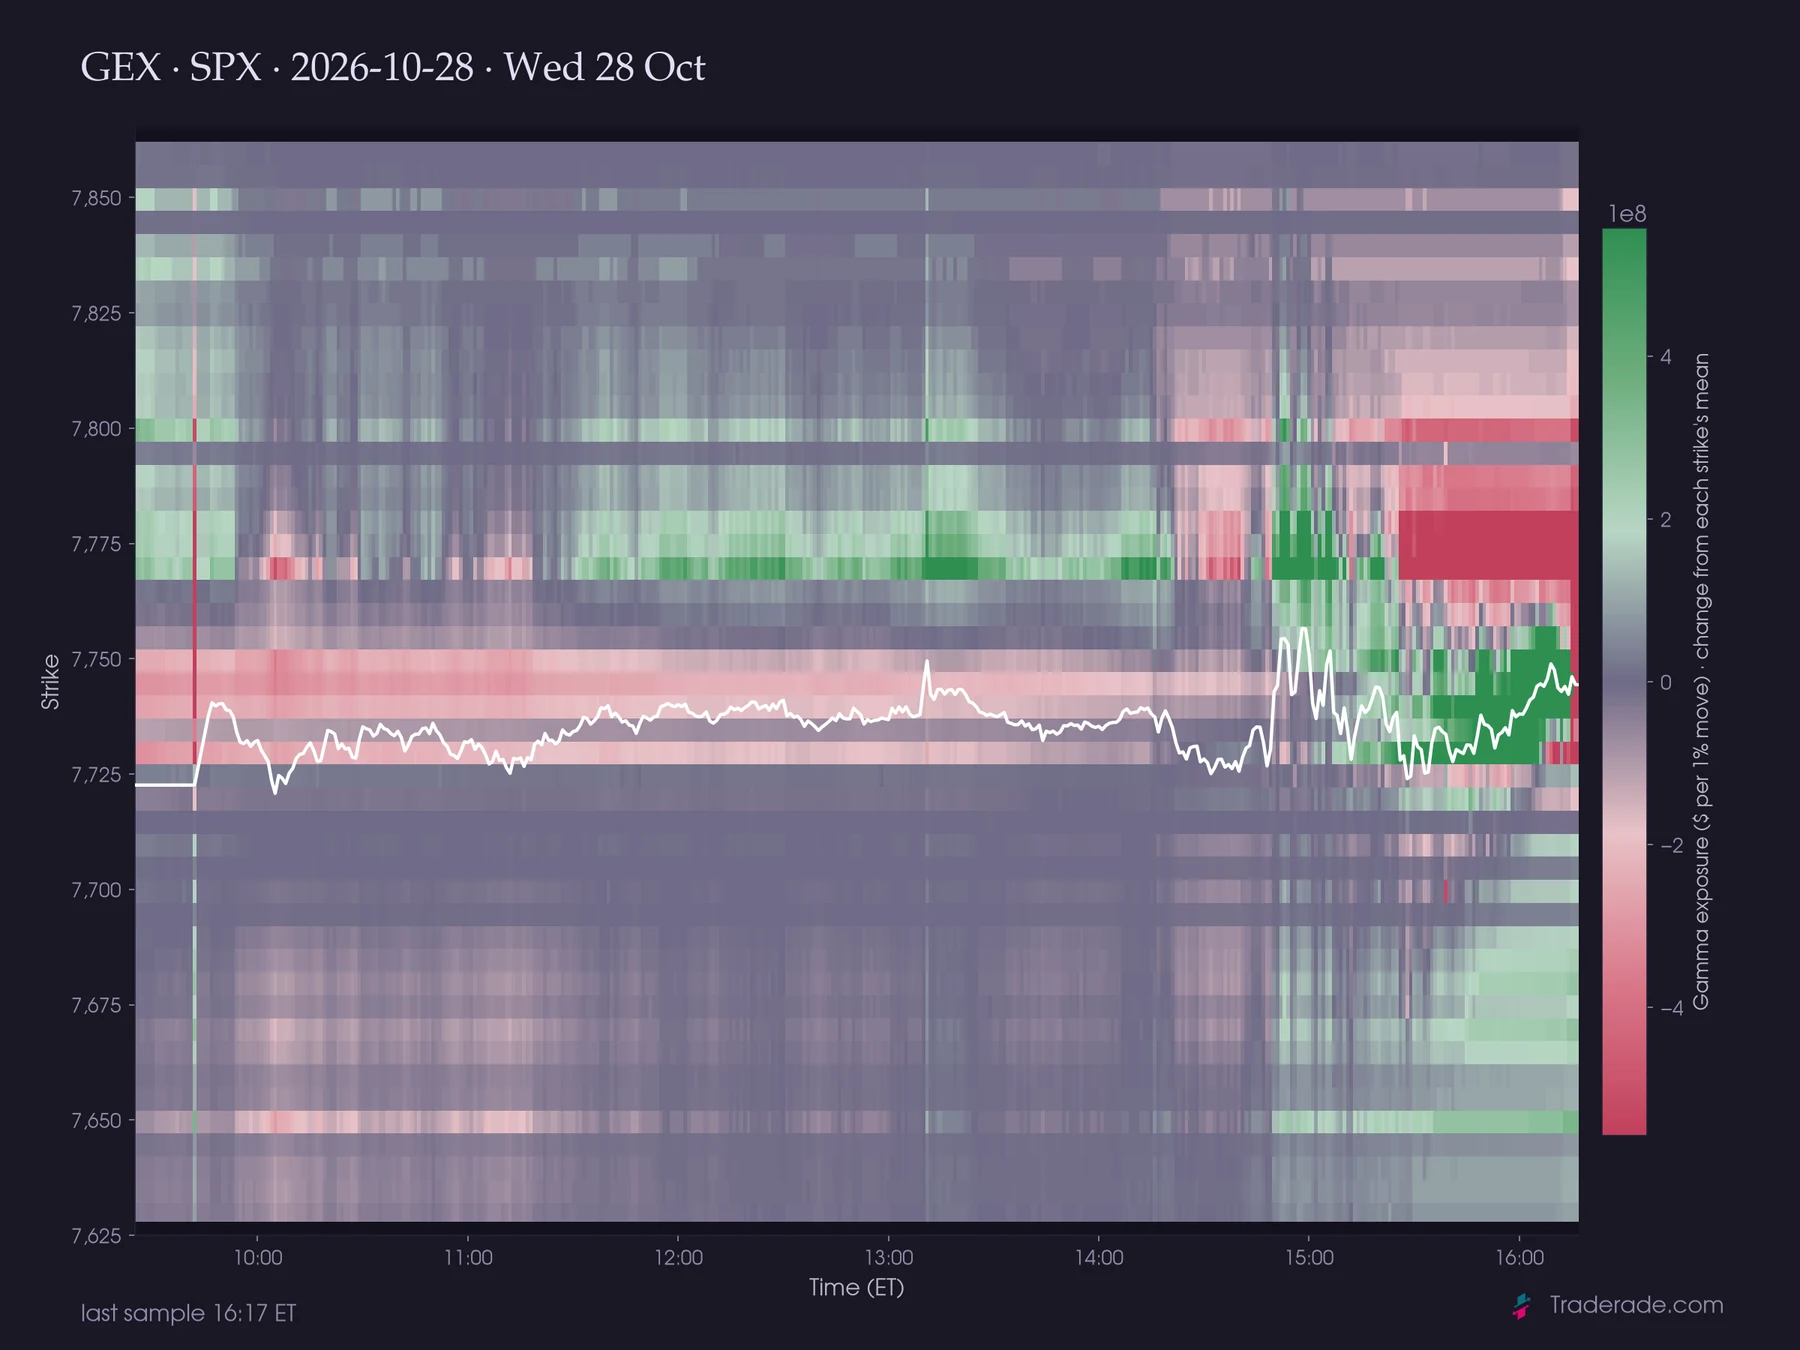
The book has a shape.
Gamma, delta exposure, levels and heatmaps. See where positioning is concentrated, and what changes when price leaves the crowded strikes.
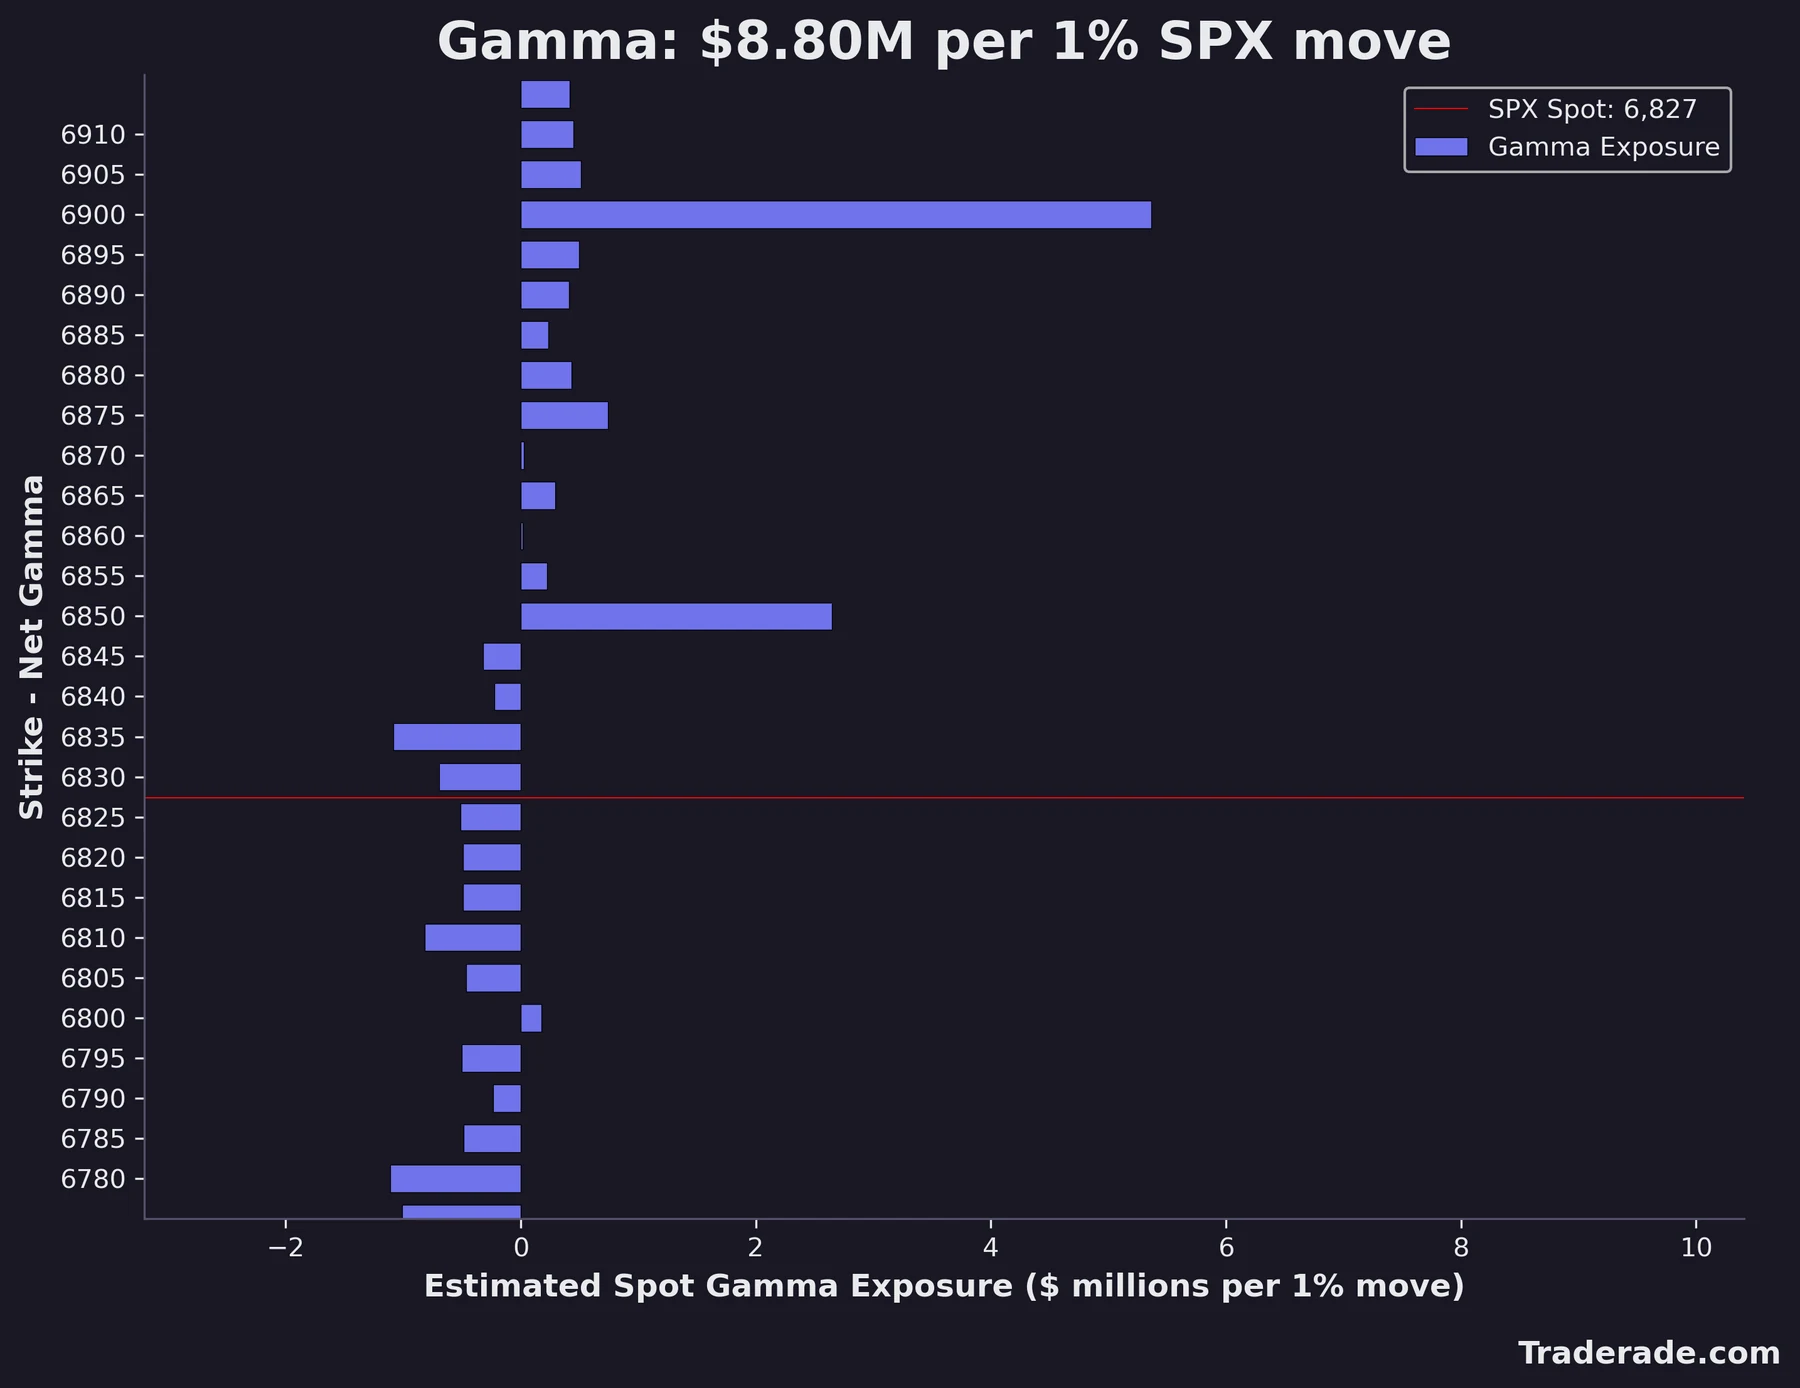
!gamma
One chart, the whole strike ladder.
Gir draws the gamma profile and marks the flip. Ask for SPX, NVDA, or any ticker in the chain.
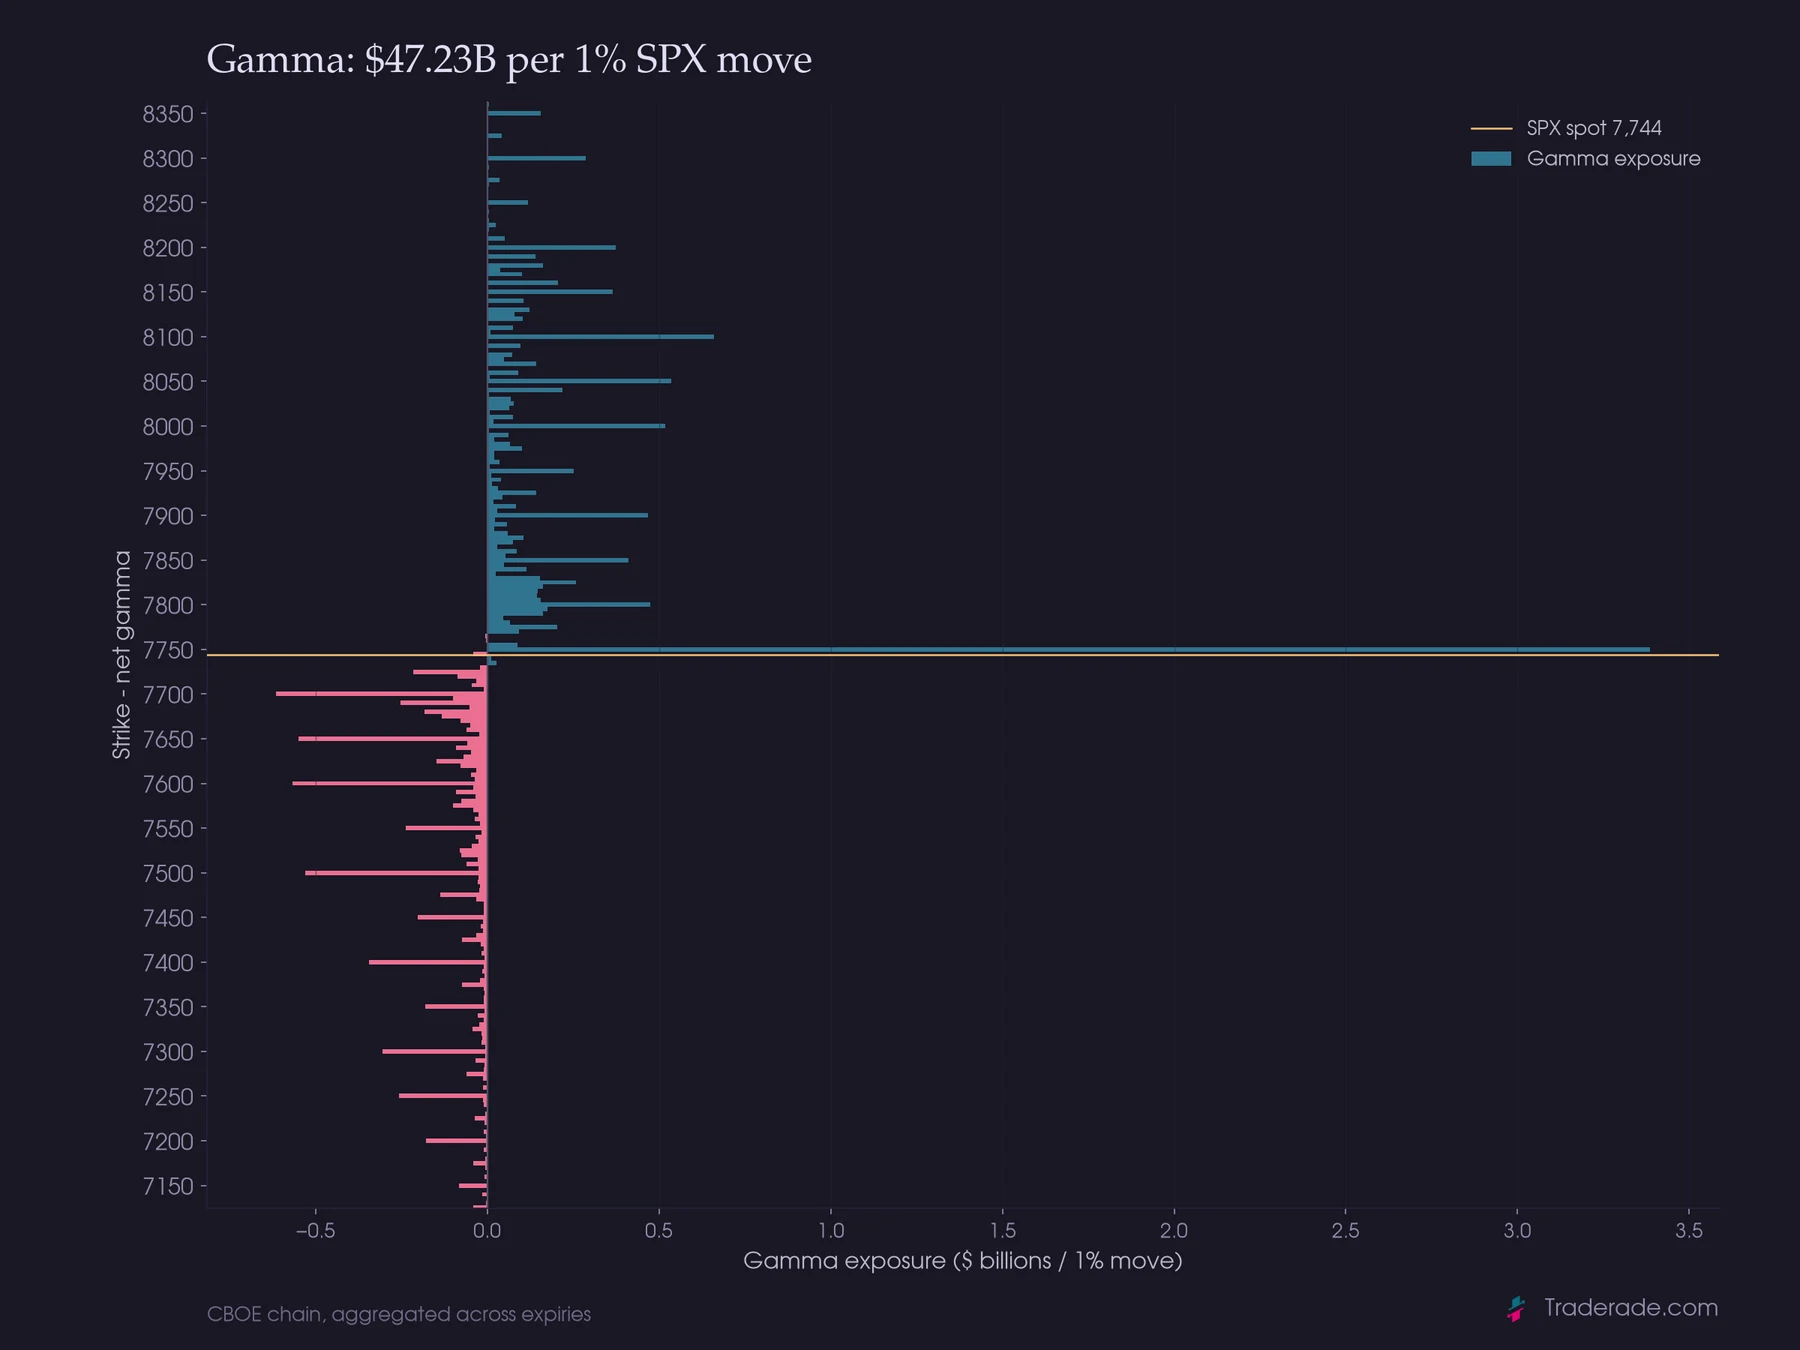
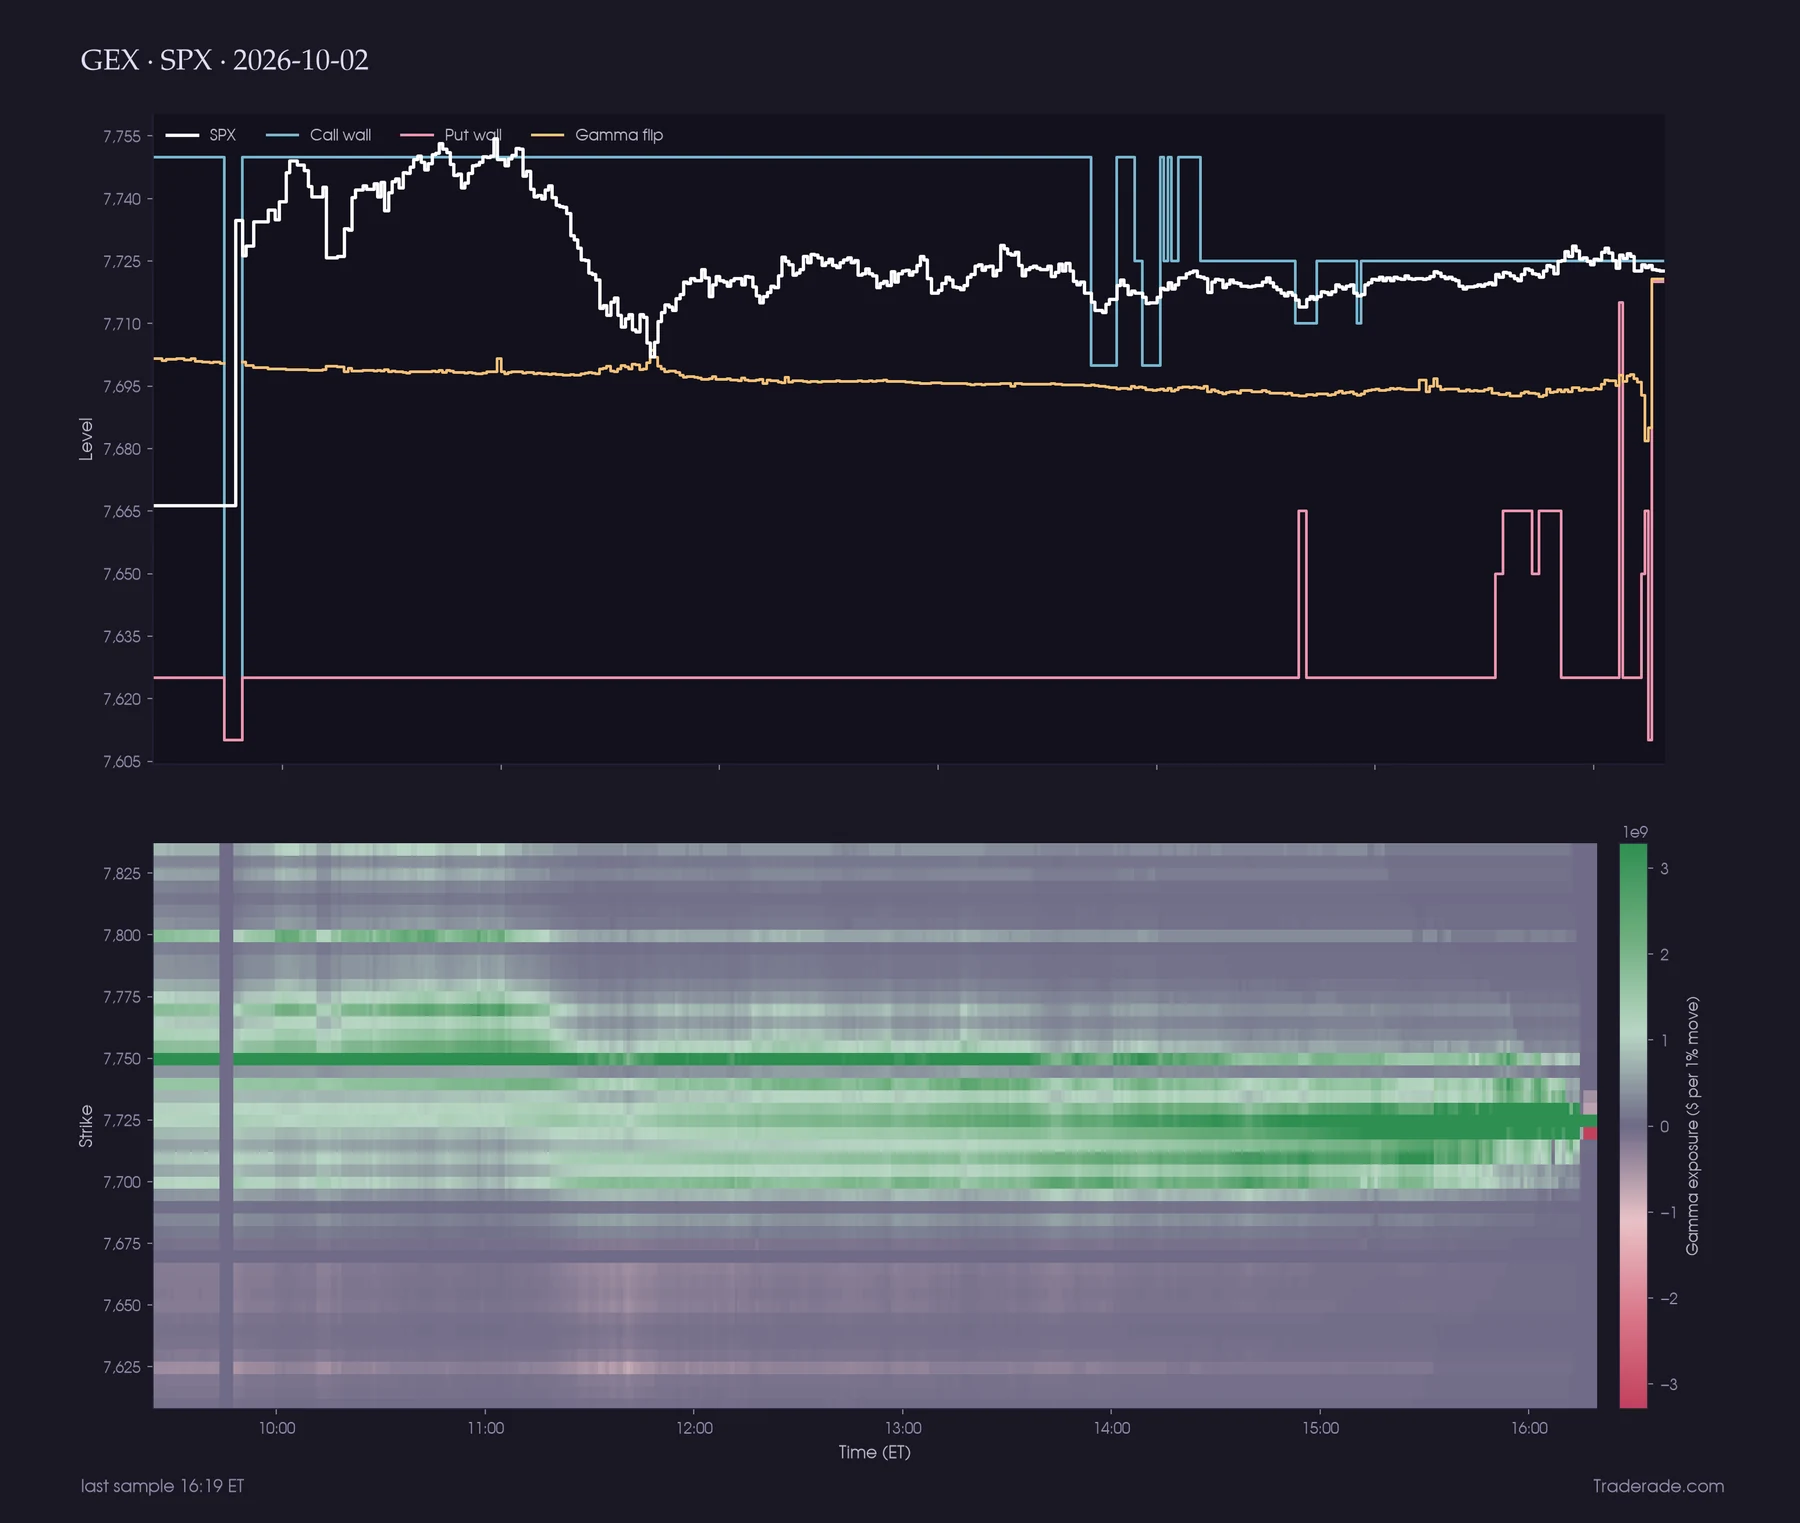
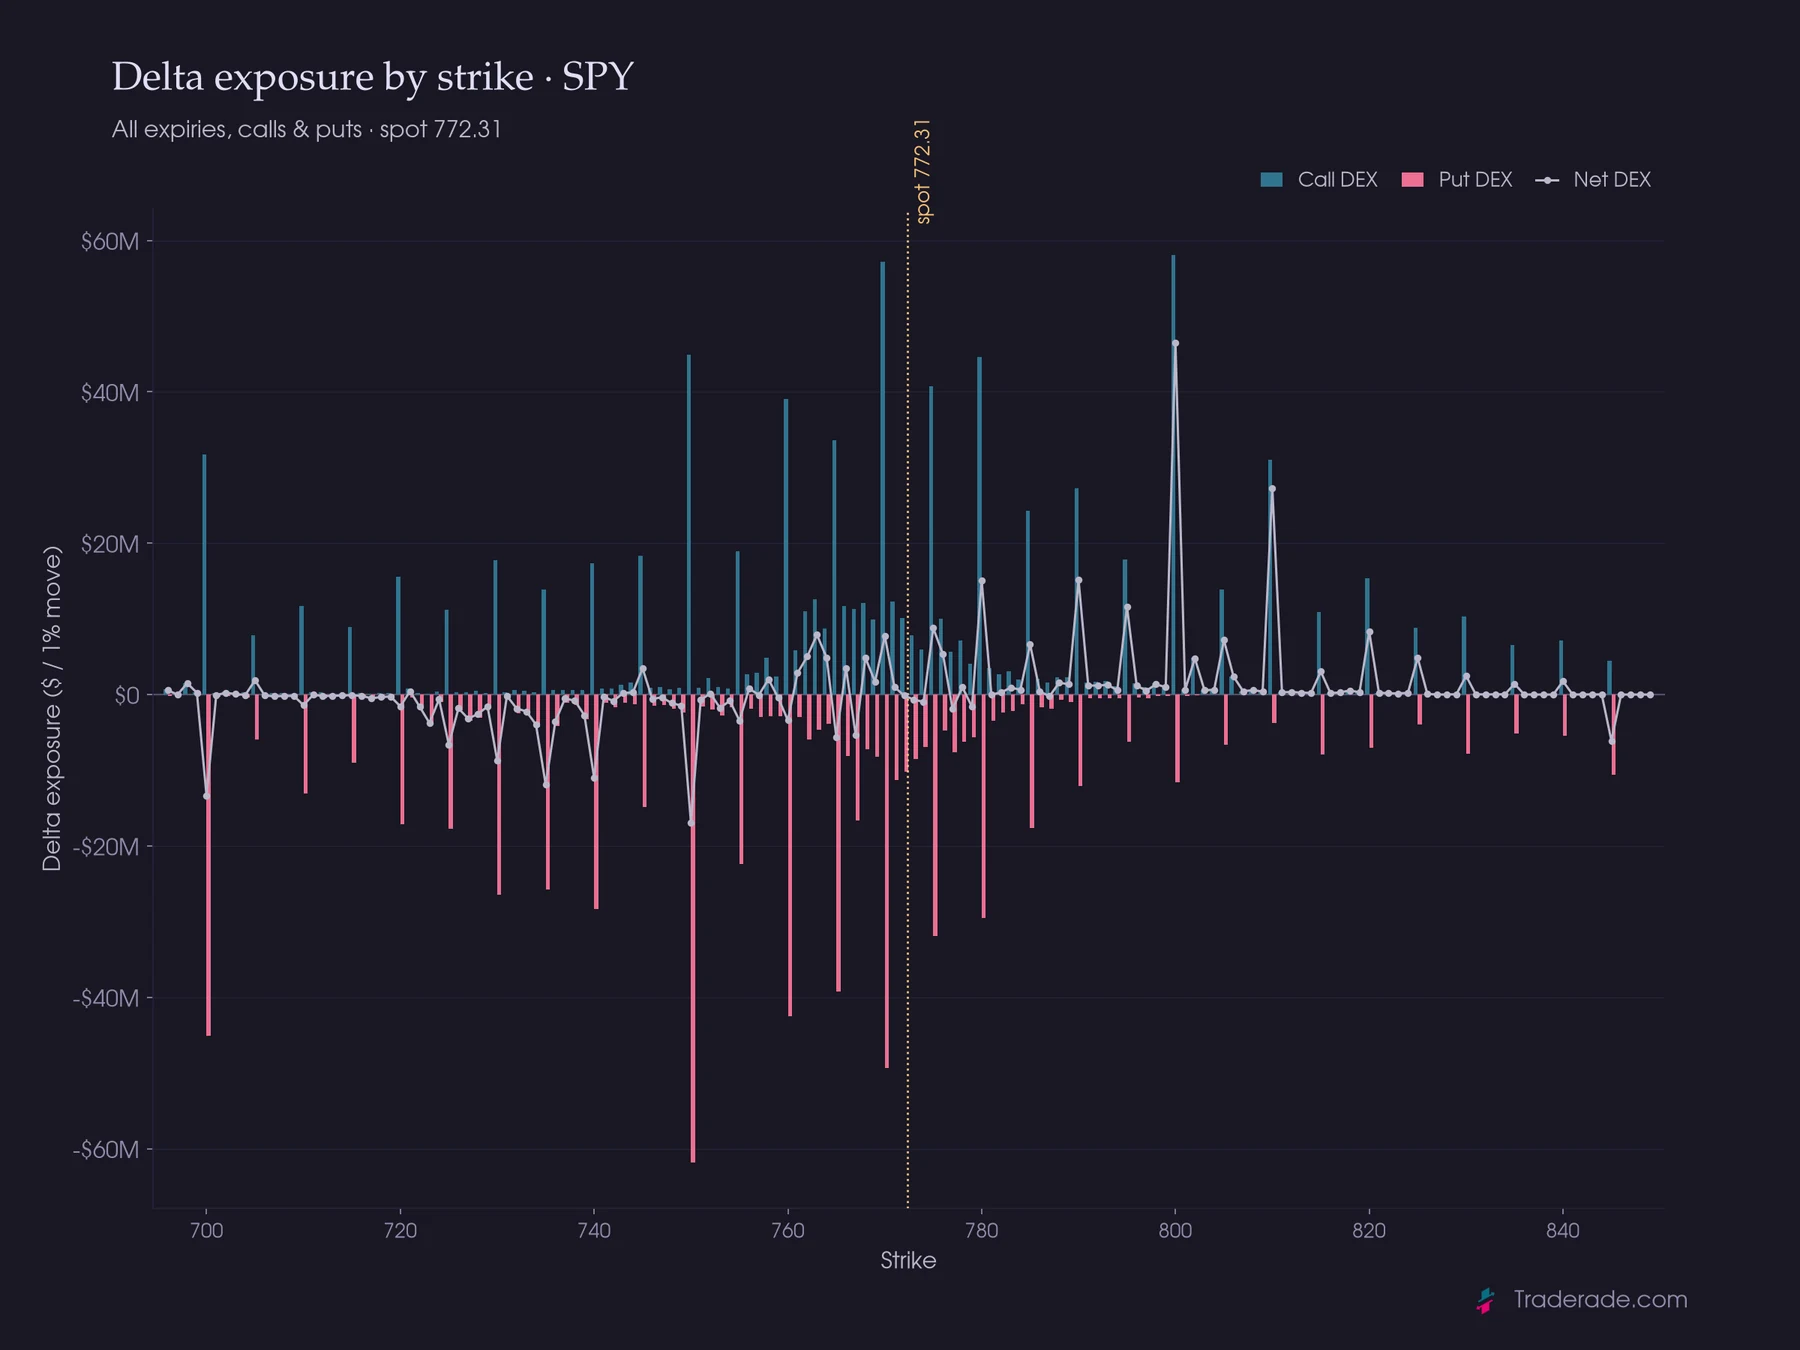
!heatmap gexGamma by strike and time!spxchartsFull-chain gamma set, with call and put wings!levelsCall wall, put wall and flip over the session!dexCall, put and net delta exposure
What the market is pricing.
A range, a distribution, and the skew between them. Gir reads the chain as a probability surface rather than a list of contracts.
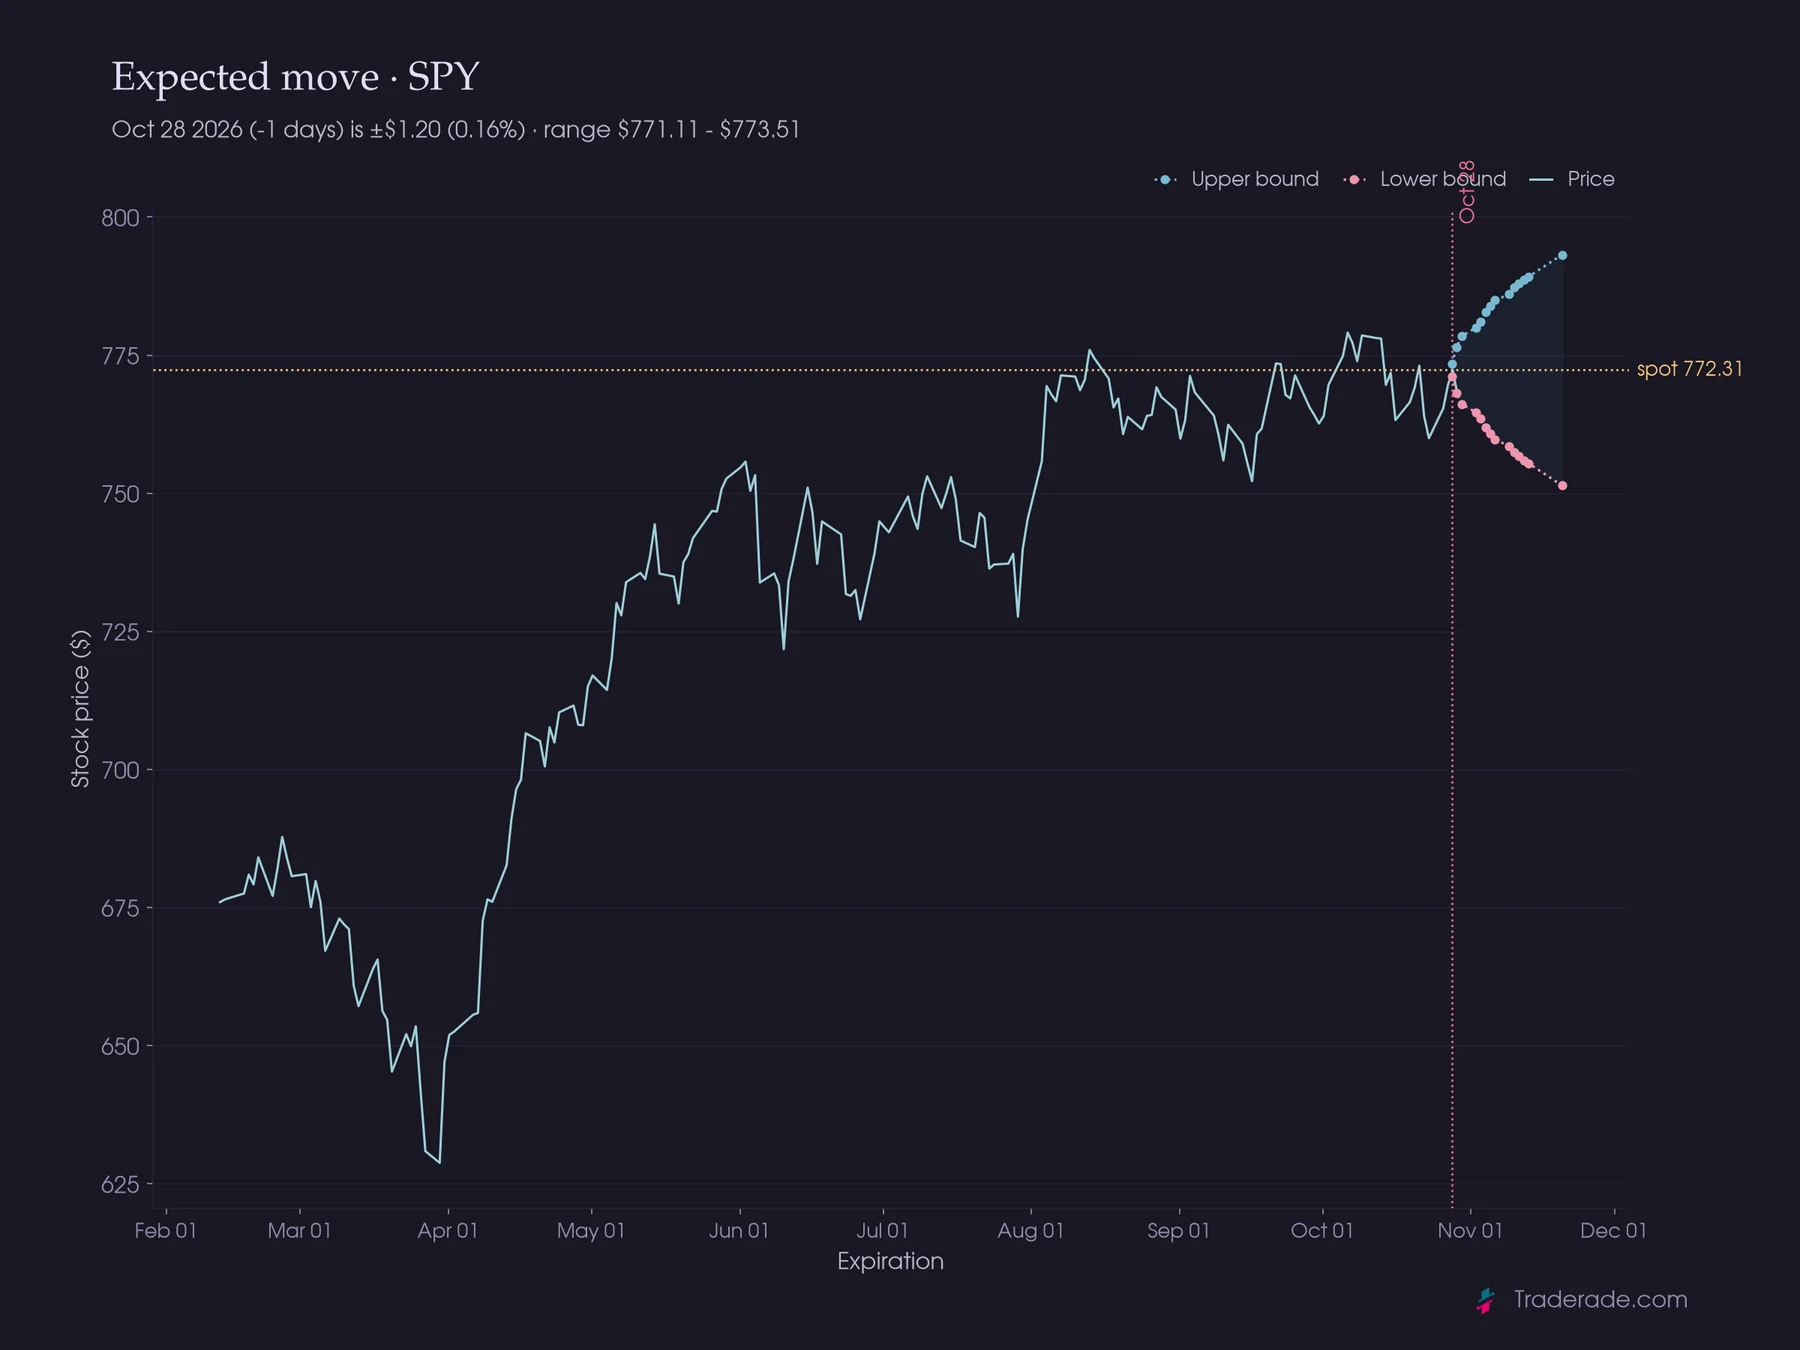
!expected
The range, before the trade.
Expected move by expiration, so the options-implied range is visible before a position is sized around it.
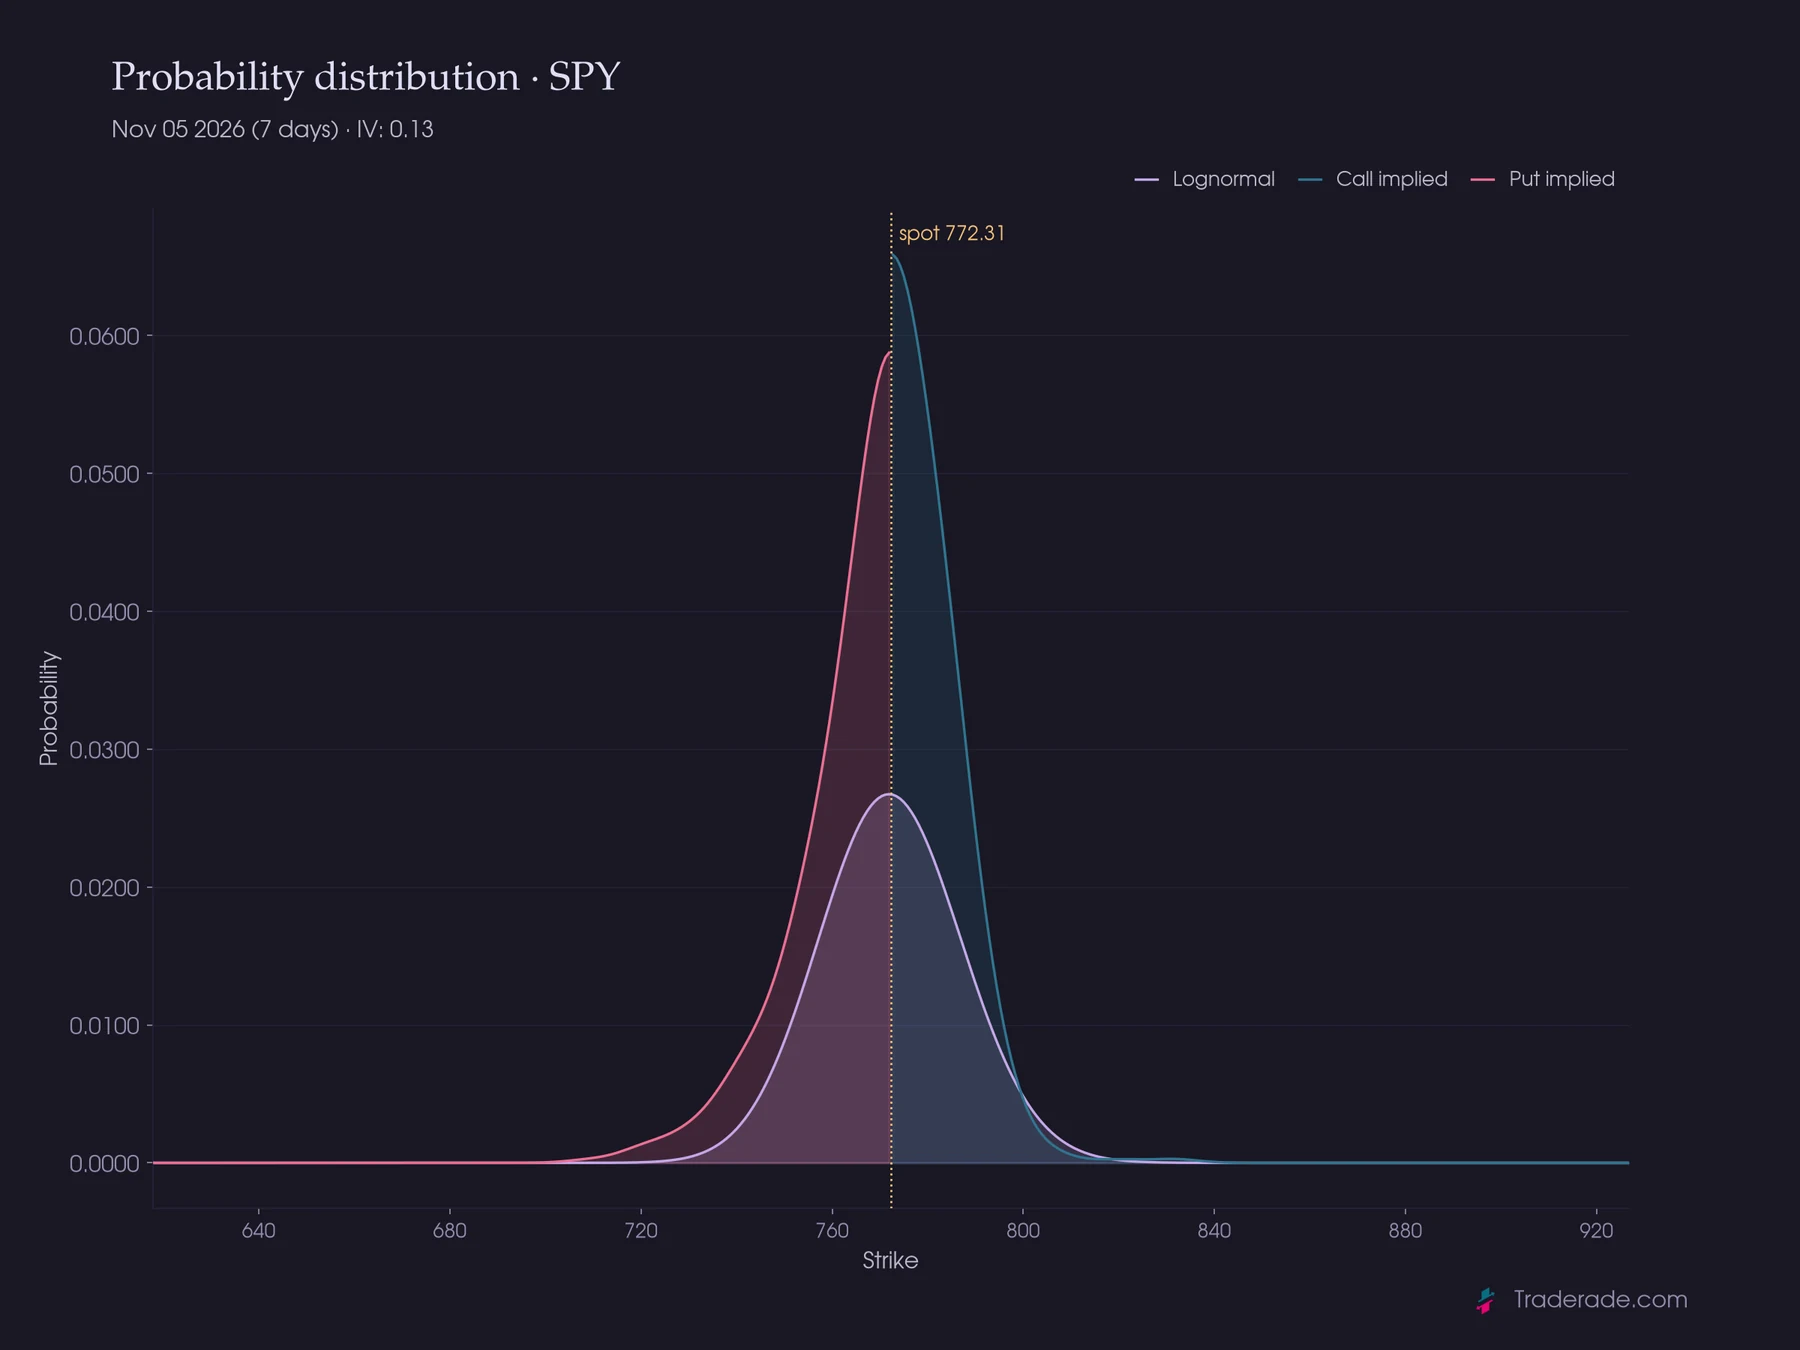
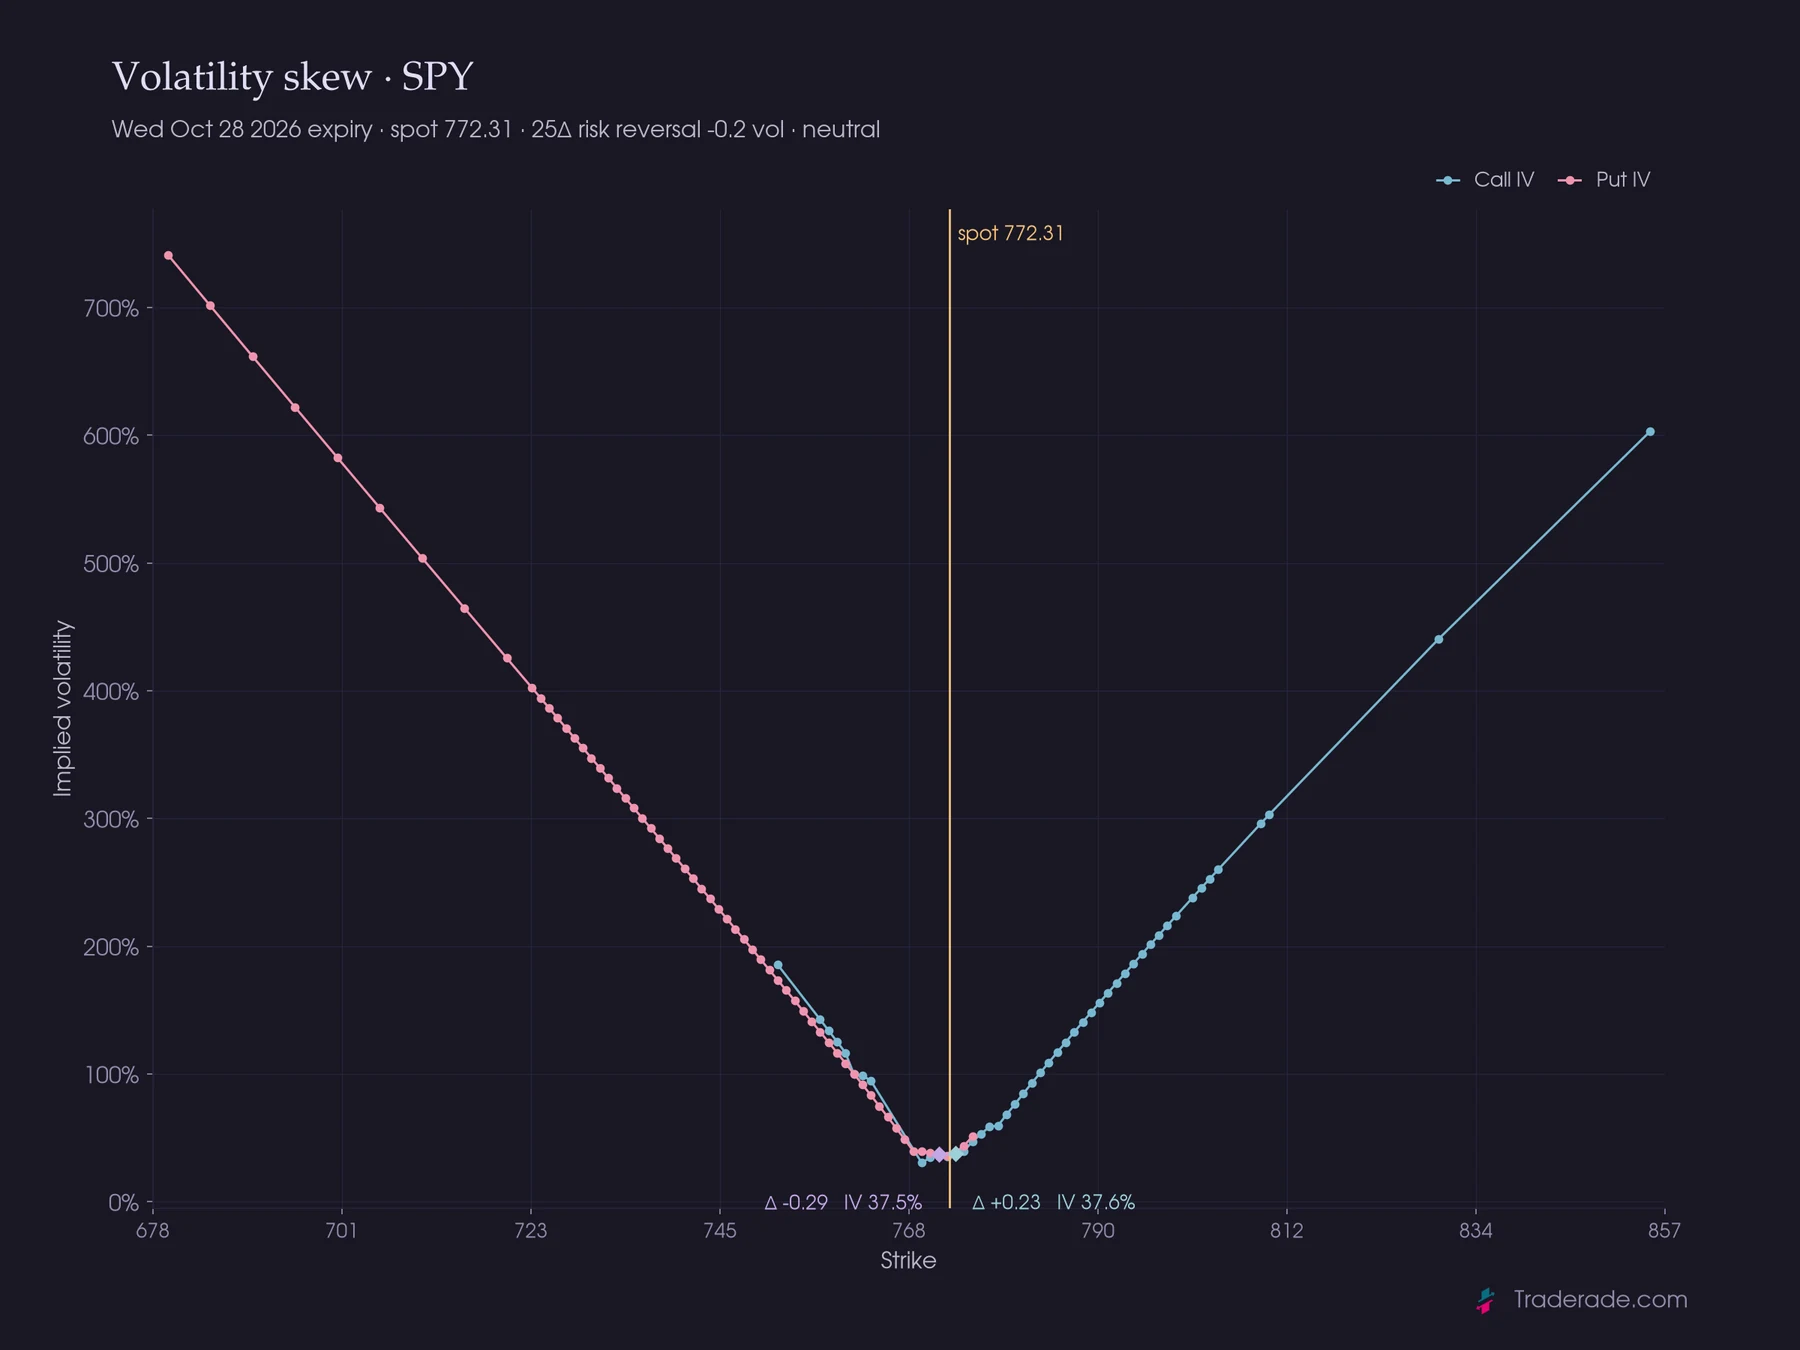
!probImplied probability distribution by strike!skewWhere protection is priced, by strike!dexCall, put and net delta exposure!oiOpen interest by strike
Which side is paying.
Cumulative net call and put premium, price and volume on one canvas. The caption names the regime, the balance, the last thirty minutes and the busiest strikes.
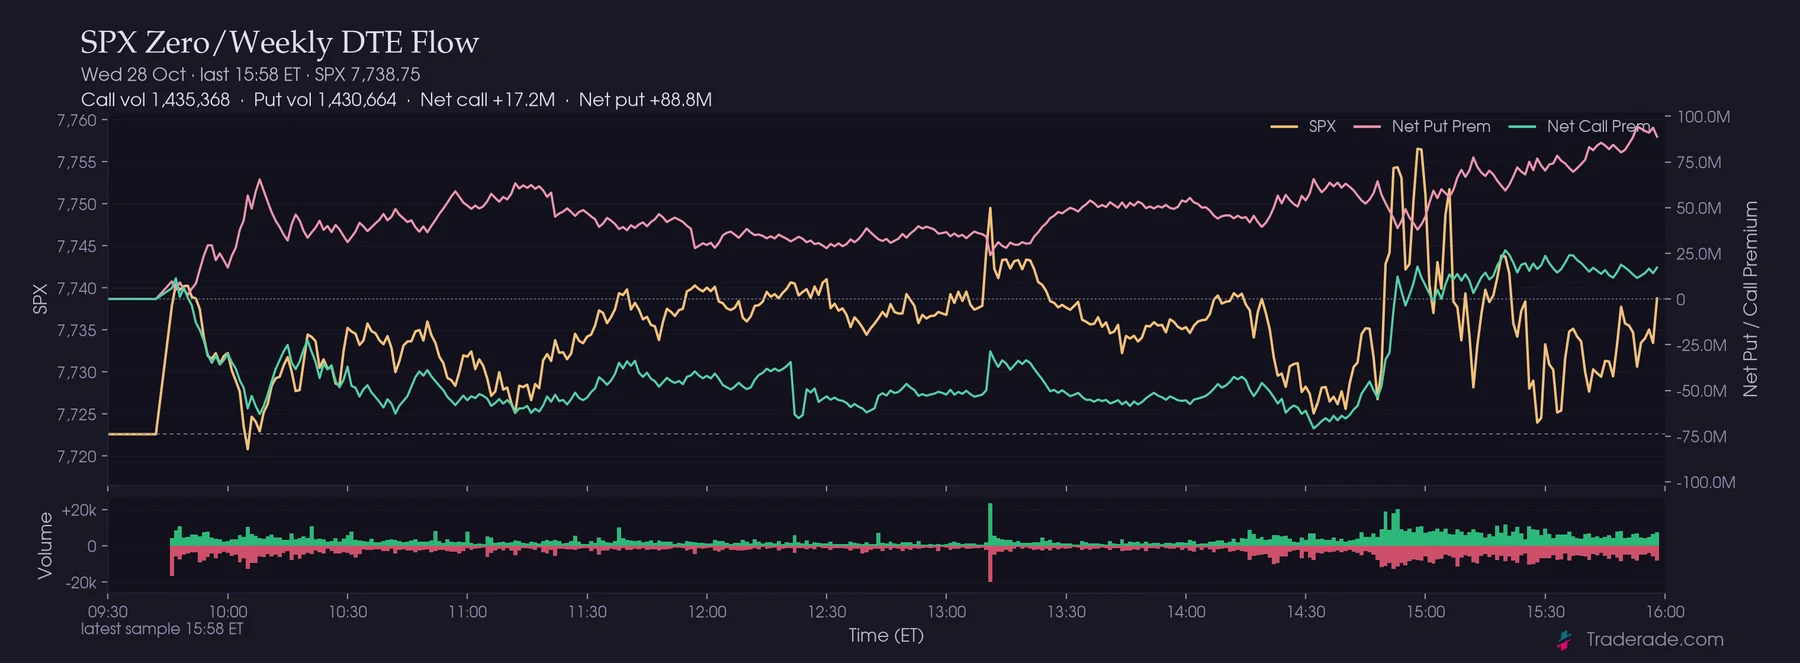
!flow · !waves
The tape, in one canvas.
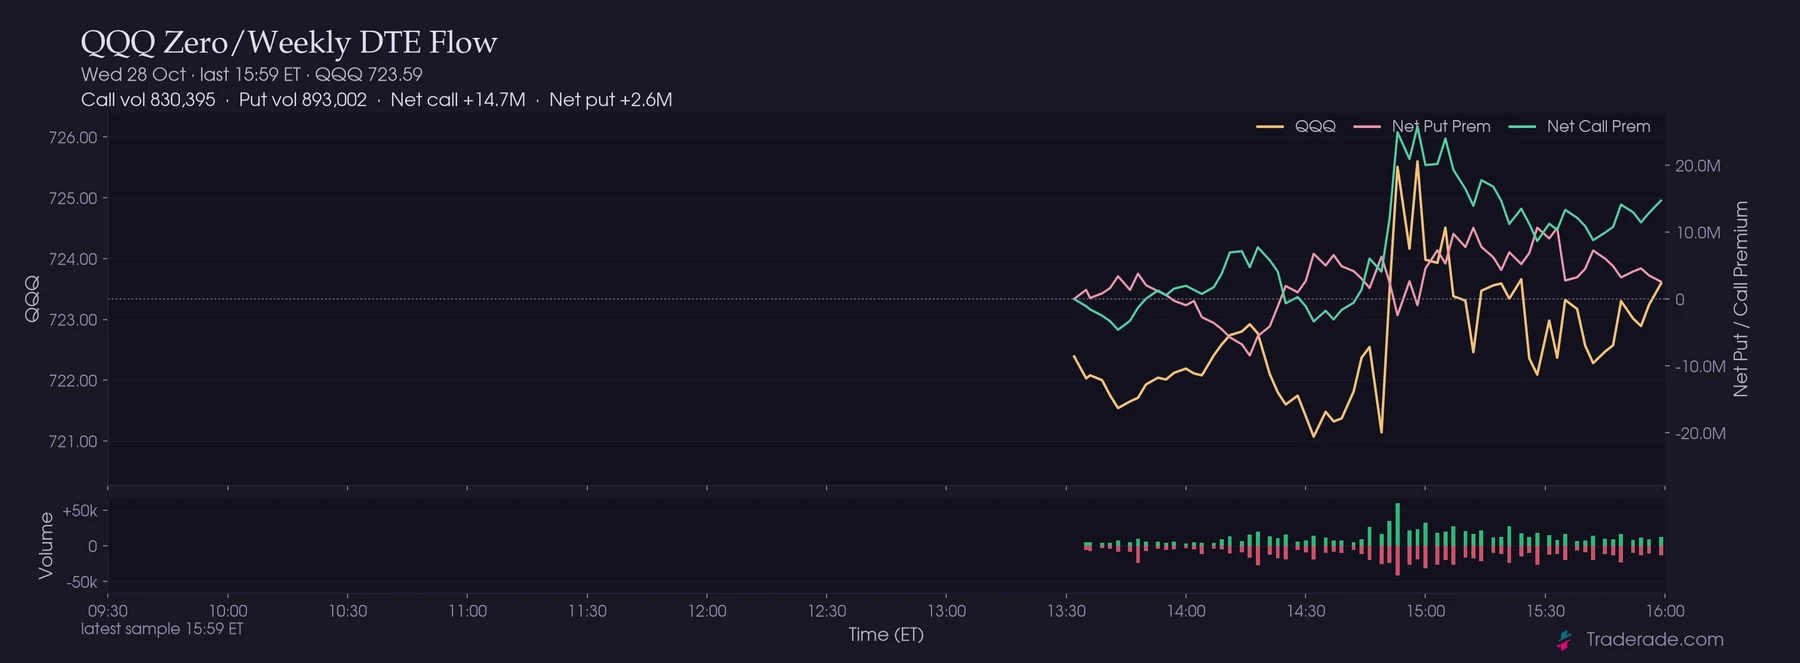
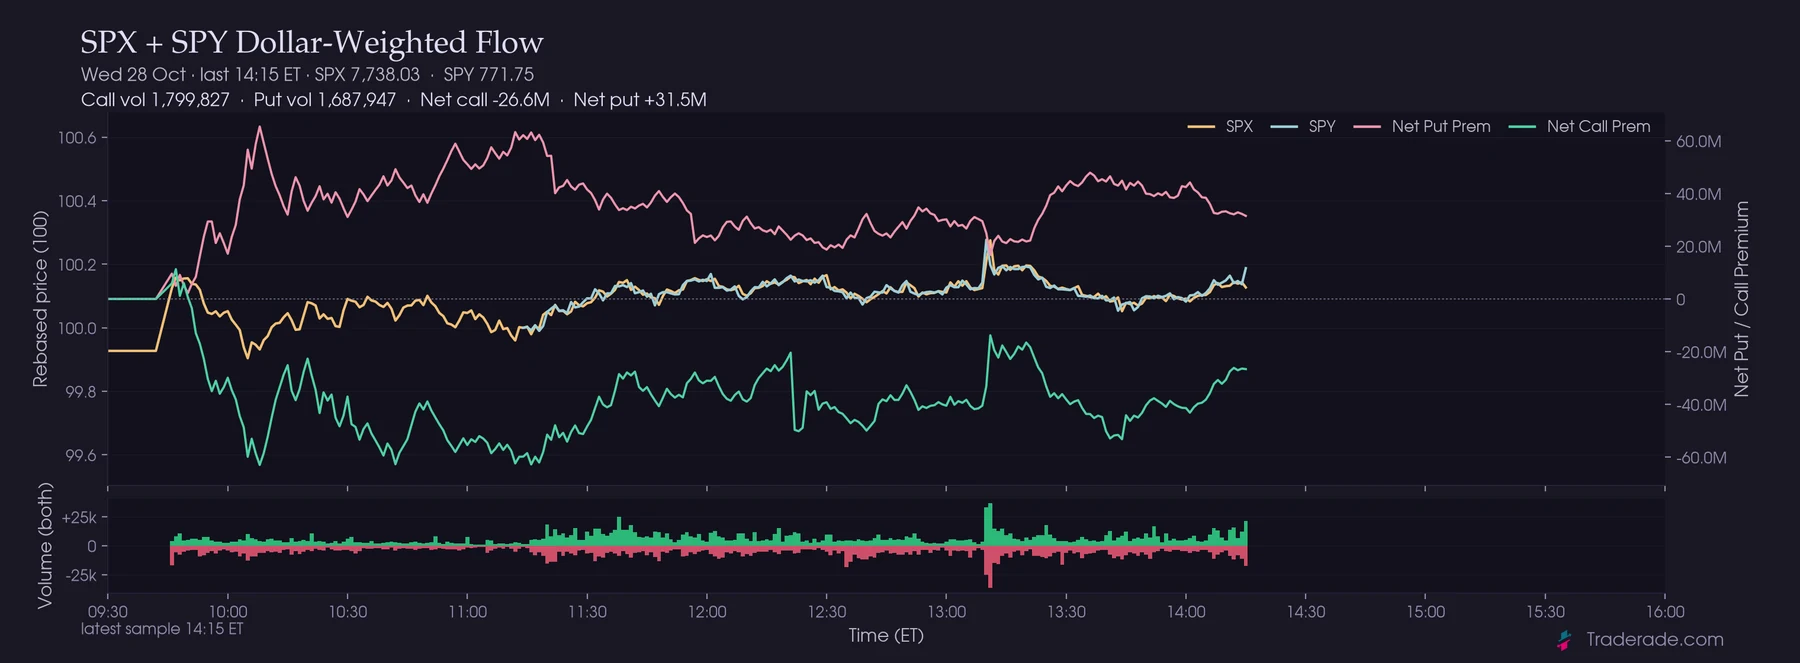
Flow follows the premium, not just the prints. !waves rotates SPX, SPY and QQQ while the caption keeps the read in words.
!flow spy spxBoth books in dollar-premium terms!flow qqqThe ETF's own strikes and flow!wavesRotating index flow in the channel
The frame around the contract.
Daily and weekly structure, and the envelope around price. These are Gir's own renders, not chart-site screenshots.
!chart · !bbw
Price, with the indicators that matter.
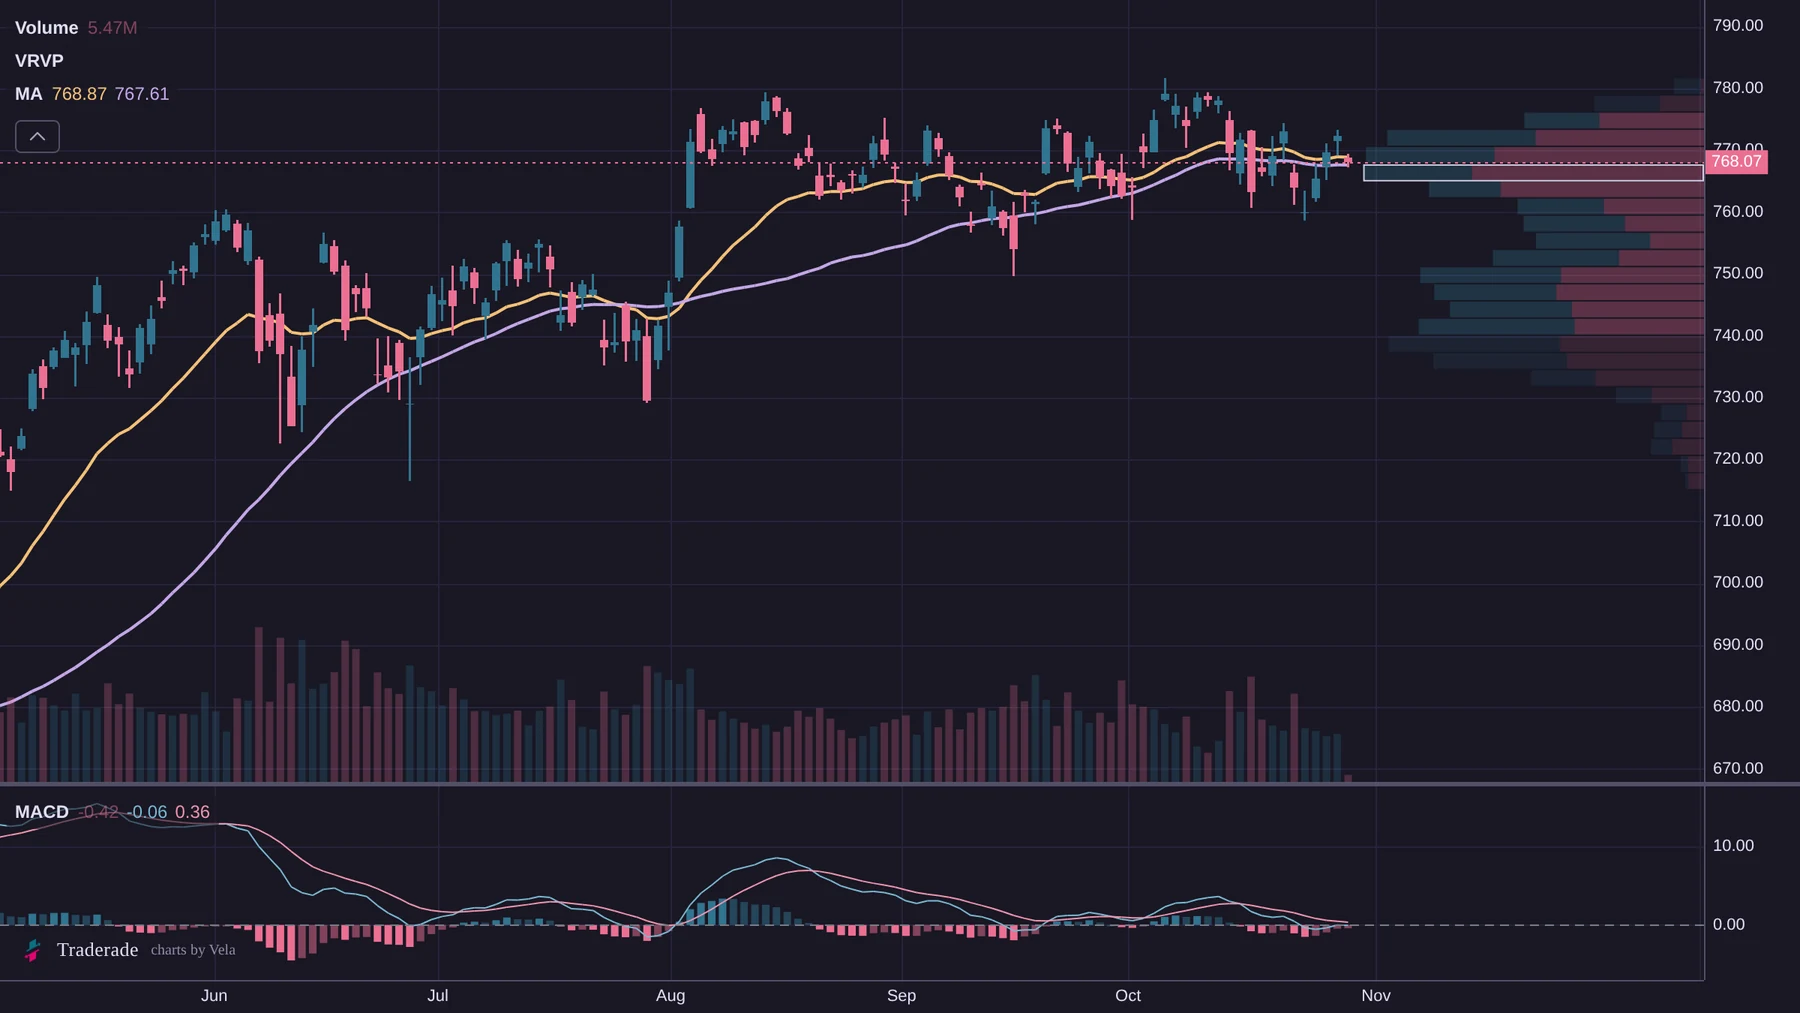
Daily and weekly candles, the moving-average frame, MACD and volume profile. !bbw puts the Bollinger envelope and volume on the week.
!chartDaily candles, 21 EMA, 50 SMA, MACD and volume profile!chartwThe weekly version!bbwWeekly Bollinger Bands and volume
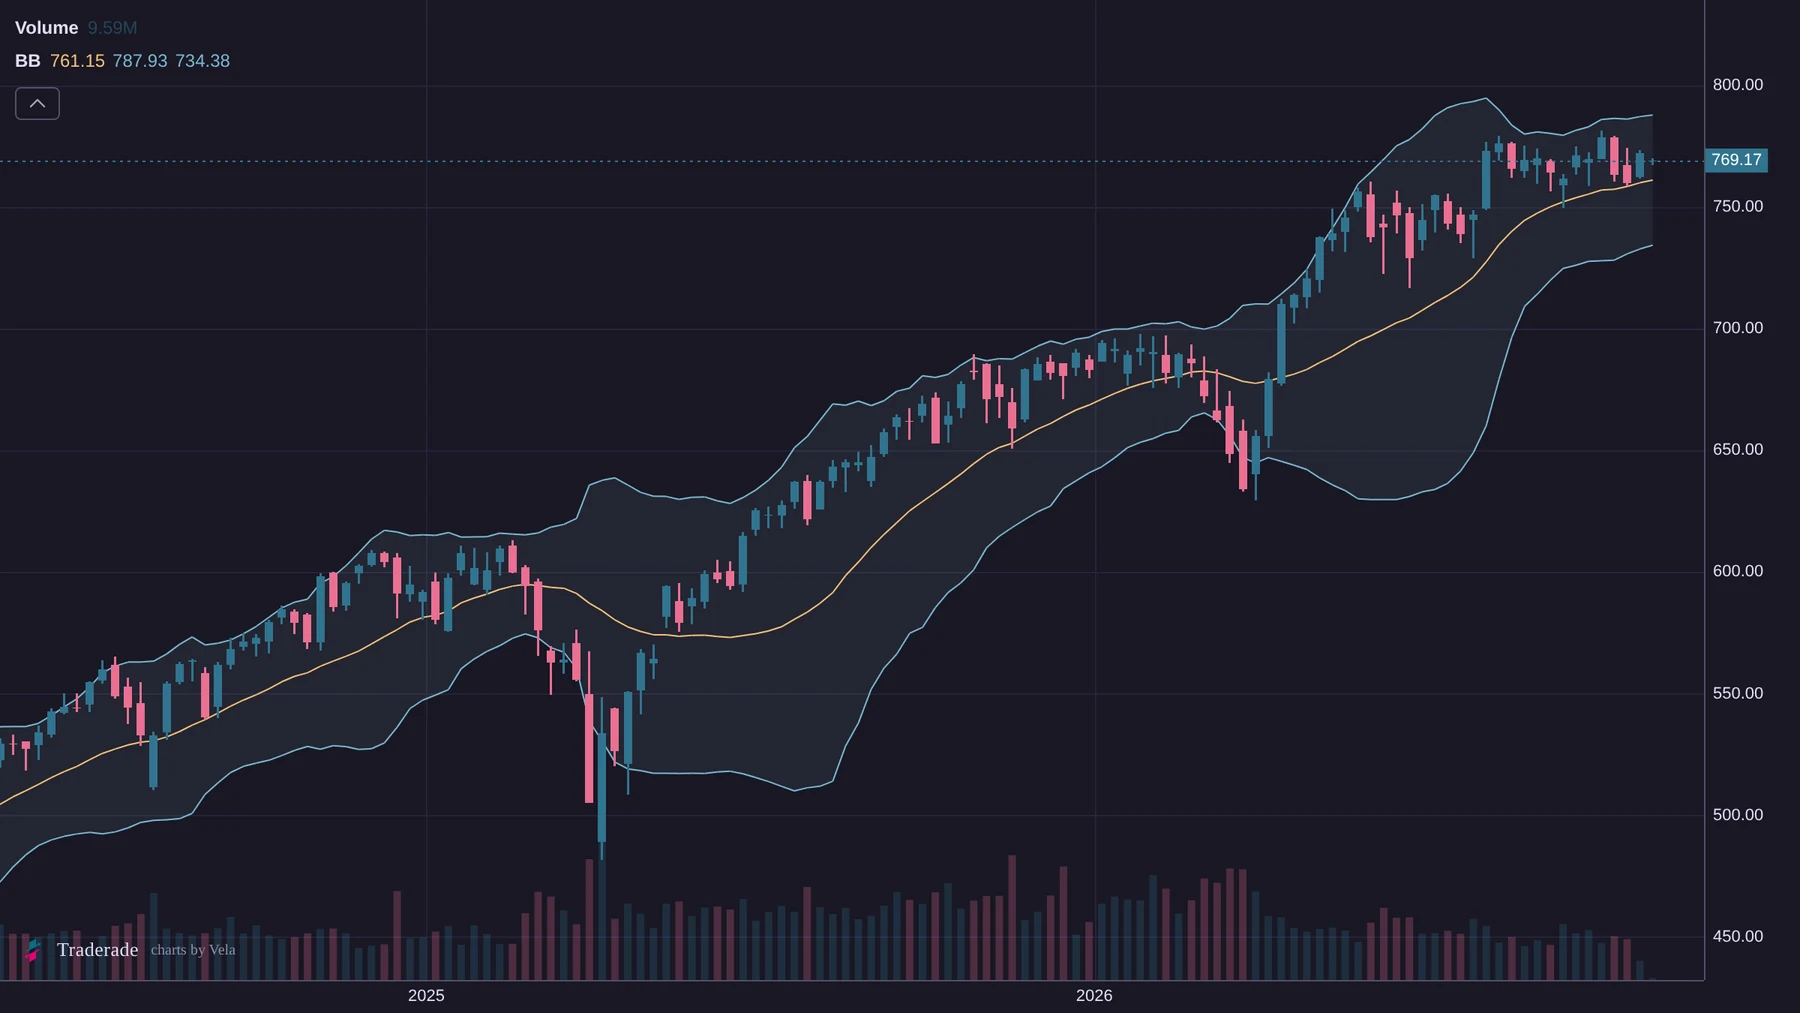
!bbw
The envelope, on the week.
Bollinger Bands without the chart-site clutter. The envelope, the closes and the volume that produced them.
From ticker to a brief.
Valuation, margins, growth and financial health. The company side of the trade, without another tab.
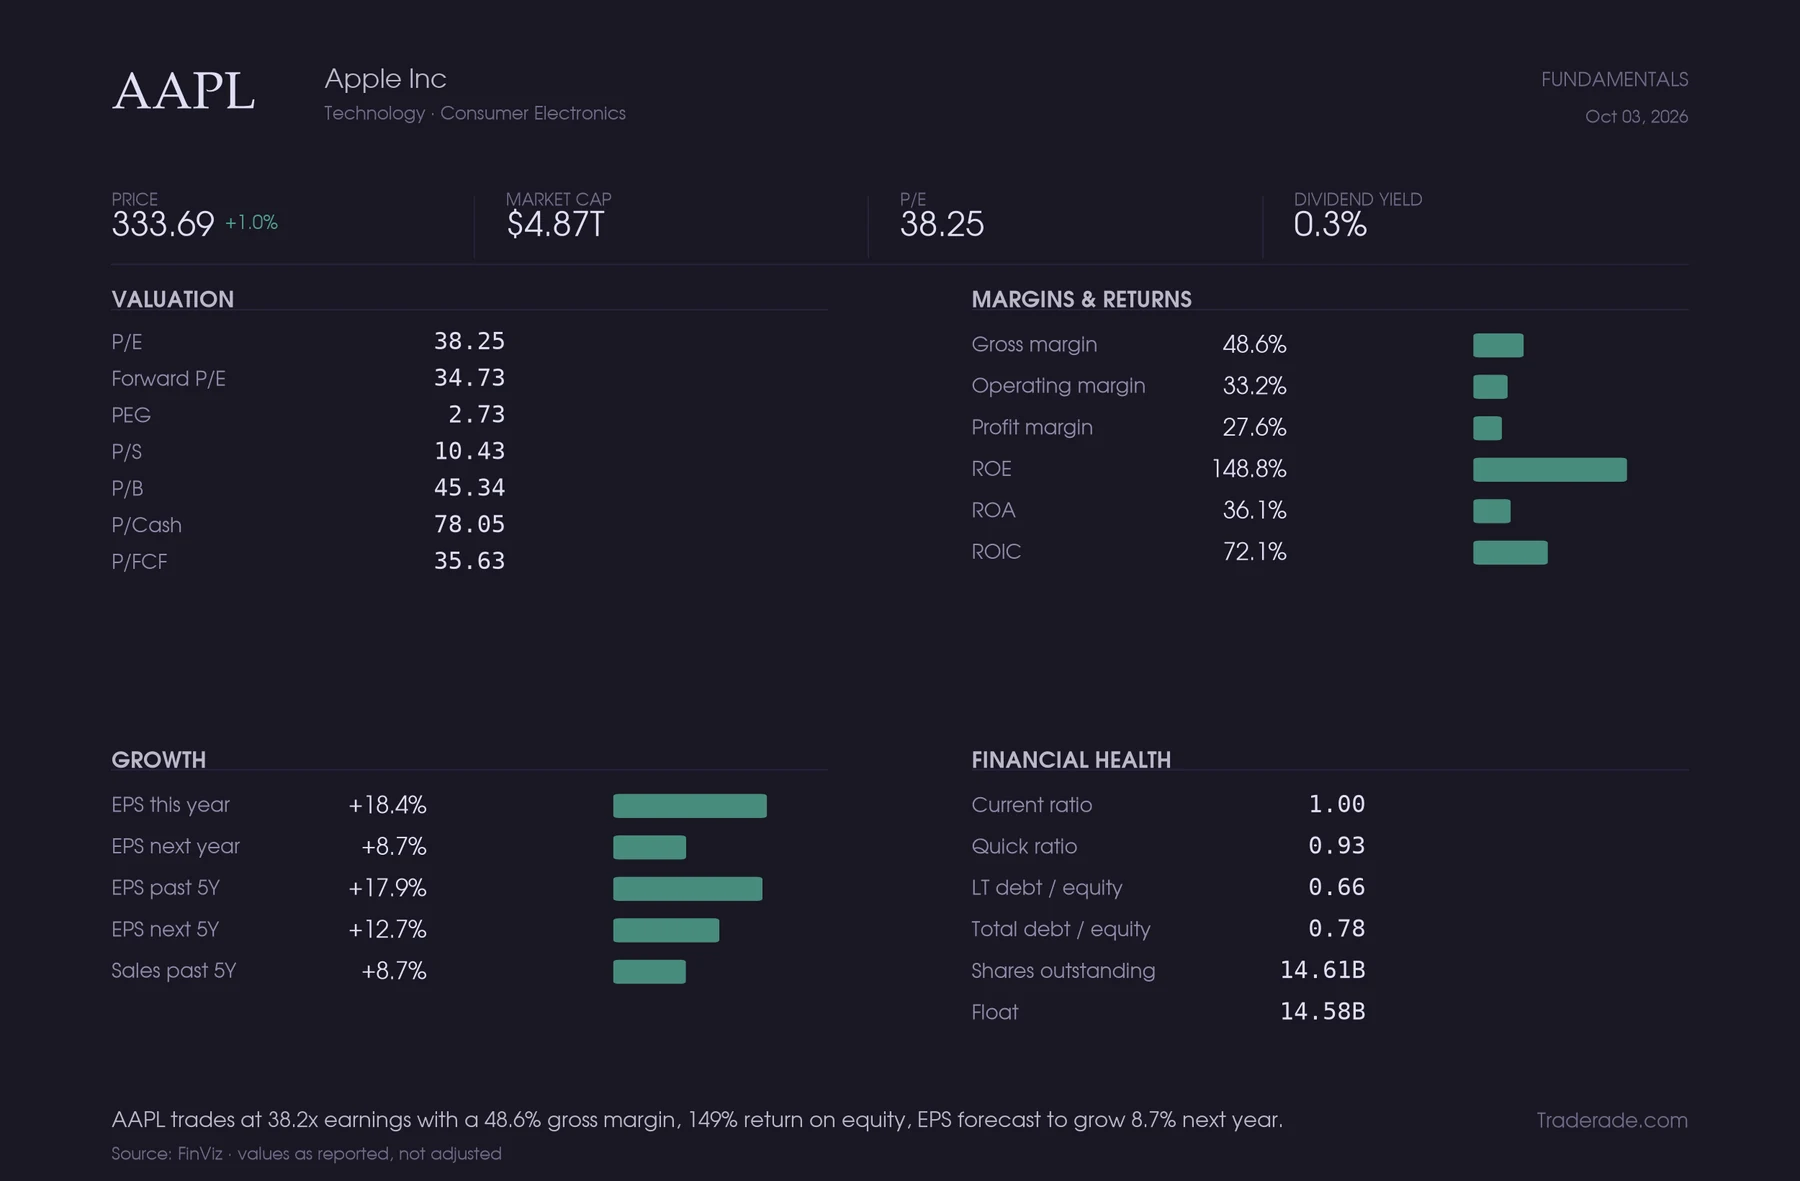
!fundamentals
The company behind the ticker.
One card for the numbers that decide whether the chart matters. Pair it with !technicals, !ownership and !performance.
!technicalsMoving averages, range, volatility and session!ownershipHolders, position changes and short interest!performanceReturns across horizons!filingsNewest SEC filings
One bot, more of the book.
The visuals above are commands. The rest of the shelf covers the chain, the flow, the market map and the company behind the ticker.
Positioning
!gamma!gamma0!skew!delta!dex!heatmap!levels!spxchartsStructure
!expected!prob!oi!vopt!optionsFlow and price
!flow!waves!chart!chartw!bbw!spxmap!treemapCompany
!fundamentals!technicals!ownership!performance!filingsContext and screeners
!calendar!auctions!status!earnings!unusual!hotFrom the first range to the closing flow.
-
01
Before the open
The calendar digest, Treasury auctions and expected move set the frame before the first print.
-
02
At the open
!wavesrotates SPX, SPY and QQQ flow while the heatmap shows where the book is concentrated. -
03
Through the day
Skew, probability and unusual activity show where the market is repricing the distribution.
-
04
After the close
!chart,!bbwand the company briefs give the session a place to land.
A reading and context tool, not an execution system.
Original by design
Gamma, skew, probability, flow and price structure are rendered from the chain, not borrowed from a chart site.
Made for Discord
High contrast, one read per chart, and a caption that survives a small screen.
Delayed, and honest
Market charts carry a timestamp. Gir is a reading and context tool, not an execution system.
"The chart is the evidence. The caption is the read."
Gir is built for traders who want the options market as a system: not another wall of numbers, and not a black-box signal. The visuals are drawn in-house; the context stays in the conversation.
Put the options market in your Discord.
Gir is available through Traderade. Request access, bring your server, and start with the Discord guide.