An options chain is the order book for one underlying, sorted by expiry and strike. Each row is a contract somebody will trade with you right now, and the columns say what it costs and whether you can get out of it later.
Every broker shows the same eight fields. The values are what decide the fill you get.
What the columns mean
Strike is the price the contract settles against. Bid is the highest price a buyer is showing, ask the lowest a seller will take, and last is the most recent trade, which may be hours old and says nothing about what you would pay now.
Volume counts contracts traded today. Open interest counts contracts that exist and have not been closed out, updated once a day after the close. Implied volatility is the annualized move priced into that strike, and delta is the change in the option’s price per one-point move in the stock. The glossary carries the formal definitions if you need them; the practical read is shorter.
Same stock at 100, same strike, both sides of the book, 45 days to expiry:
| Strike | Bid | Ask | Volume | Open interest | IV | Delta |
|---|---|---|---|---|---|---|
| 100 call | 4.35 | 4.50 | 3,240 | 12,600 | 30.0% | 0.54 |
| 100 put | 3.95 | 4.10 | 2,870 | 14,100 | 30.5% | −0.46 |
The put’s delta is smaller in size because the forward price sits above spot, so the put is slightly out of the money on a forward basis even though both strikes are at 100. At this distance the two implied volatilities are half a point apart. Ten points out of the money they stop being close.
Bid, ask and where you actually get filled
The spread is the price of admission and the price of the exit. On that 100-strike call quoted 4.35 by 4.50, you pay 4.50 to get in and sell at 4.35 to get out. The round trip costs 0.15 whether the stock moves or not, which is 3.4% of the 4.425 mid.
On a cheap option the same 15 cents is a different animal. Take an out-of-the-money call quoted 0.80 by 1.00. The spread is 0.20 against a 0.90 mid, or 22%, and the mid has to travel the full 0.20 before you break even crossing both ways. With a 0.25 delta the stock needs to move about 0.80 just to recover the spread, before a single day of decay.
You do not have to pay the offer. A marketable limit order sits at the ask for a buy and at the bid for a sell: it fills like a market order while the quote is there and refuses to fill worse if the quote moves. Resting a limit inside the spread sometimes saves a few cents, though on a 20-cent spread over a 90-cent option the saving rarely covers the risk of going unfilled on the day you wanted in.
Price the entry off the ask for a long option and off the bid for a short one. Any P&L worked out from the mid flatters the trade.
Volume and open interest are not the same number
Volume resets every morning. Open interest is a running count of contracts still standing, and it only changes after the close, when the clearing house nets the day’s trades against each other. A strike can show 12,600 open interest and 40 contracts traded today.
That combination means the position exists and nobody is working it. For a buyer the exit is the problem, because open interest is who could take the other side of your sale and volume is who is actually quoting. A strike with thousands of contracts open and a handful of prints will still fill, but you are dealing with one or two market makers and the quote will say so.
The reverse case is worse than it looks. A strike showing 900 contracts of volume against 300 open interest has seen plenty of trading, and much of it can be the same contract passing back and forth intraday. The standing liquidity is thinner than the print suggests. Check both columns before you size, and check them again on the day you plan to leave.
Finding the strike with money in it
Liquidity is mechanical. Apply these filters in order and skip any strike that fails one:
- Open interest at the strike in the hundreds at minimum, and a thousand or more on index products like SPX and SPY.
- Crossing the spread costs under 5% of the mid on contracts priced above $2.00, and under 10% below $1.00. Above that the option is a fee rather than a position.
- Delta between 0.30 and 0.60 for a directional swing. Below 0.30 you are paying for a move that has to arrive soon; above 0.70 you are paying full premium for stock-like exposure.
- Volume today of at least a few hundred contracts, so the quote you are looking at came from a market that is open.
Those filters push you toward the front expiries and the strikes within a few percent of spot, which is where a multi-day trade belongs. Most of the chain is decoration: a 10-delta strike six months out can show open interest in the tens, and no filter will rescue it. The options guide covers which structure suits which thesis; the chain tells you what the structure costs.
Implied volatility across strikes
Read the IV column down the strikes rather than across one row. On an index, the 90 put and the 110 call sit ten points either side of spot and the put carries several points more implied volatility, 34% against 28% in a common shape. The put costs 1.08 with a 0.16 delta while the call costs 1.00 with a 0.19 delta: more money for less movement.
That is skew. It exists because funds buy puts to hedge a book and few buy calls for the same reason, so downside protection carries a standing bid. On a chain it shows as a smile that tilts up on the left wing.
Buying the expensive wing is a separate decision from being right about direction. You can call the drop correctly and still lose on a long put if implied volatility slides back while the move grinds out, because you paid for the hedging demand as well as the exposure. Compare the IV on the strike with the range the stock has actually delivered over the past month before you decide the premium is fair.
Reading a chain for a multi-day position
Three numbers decide a multi-day option trade: days to expiry against how long you expect to hold, delta against the capital at risk, and the implied volatility you pay against the stock’s recent realized range.
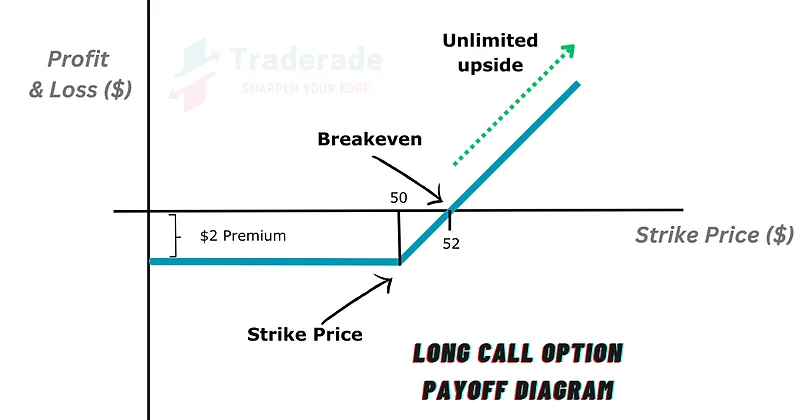
Take a $50,000 account risking 1%, which is $500. The 45-day 100-strike call is quoted 4.35 by 4.50 and you pay the offer. One contract costs $450, so that is the position. Two would be $900 and break the risk limit before the stock moves a cent. A long option can lose the whole debit, so size from the premium.
Delta 0.54 makes one contract move like 54 shares. A two-point move in the stock is worth about $108 at that delta, against $450 of capital. Hold ten days and 45 days to expiry become 35. If the stock reaches 102 and IV slips from 30% to 28%, the call is worth about 4.81, a gain of $31 after the spread. At a flat 30% IV the same move is worth 5.05, or $55. Sit still at 100 for those ten days and the call is worth 3.89: down $61 with the stock exactly where you left it.
Delta alone suggested $108. Decay and the volatility move took the rest, which is why the holding period and the IV you pay belong in the same decision as the strike. If the thesis needs a month, buy the expiry two months out and pay for the time. Risk management starts the sizing arithmetic from the debit.
What the chain does not tell you
Every number in the chain is public and none of it names the counterparty. Open interest records that a contract exists. It does not record who is long it. A print of 500 contracts could be a fund opening a hedge, a market maker unloading delta, or two traders swapping the same risk, and the chain cannot separate them. Whether a trade opened or closed a position only becomes visible with trade-level data that tags the aggressor, which most retail feeds do not carry.
The dealer’s book is missing too. Dealer positioning is estimated from open interest plus an assumption about which side dealers stand on, and the estimate is an inference rather than an observation. That limit applies to every gamma or exposure read you will see, including the ones on this site.
What is left is price. The chain shows what the market will pay right now for a defined outcome, and nothing about where the stock goes next. Options 101 covers the contract mechanics, and Options Viz computes the exposure side from the same open interest the chain displays.
What do the columns in an options chain mean?
Strike is the settlement price, bid and ask are the live quotes, and last is the most recent trade, often stale by hours. Volume counts contracts traded today, while open interest counts contracts still open after the previous close. Implied volatility is the move priced in, and delta is the price change per one-point stock move.
Why does the bid-ask spread cost more than it looks?
You pay it twice, on entry and exit. A 0.15 spread on a 4.425 mid is 3.4% of the position before the stock moves. On a cheap 0.90 option a 0.20 spread is 22%, and the stock has to travel far enough to recover it. Price entries off the ask and exits off the bid.
Does high open interest mean an option is easy to exit?
It means the contracts exist, not that anyone is trading them today. Open interest of 12,600 with 40 contracts of volume leaves you dealing with one or two market makers, and the quote will be wide. Check volume beside open interest, and check both again on the day you plan to sell.
Which strike should a swing trader pick?
One that passes the filters: open interest in the hundreds or more, a spread costing under 5% of the mid on contracts above two dollars, and delta between 0.30 and 0.60. A strike that fails any of those is either too thin to exit or priced like a lottery ticket.
Why do index puts carry higher implied volatility than calls?
Demand for downside protection is structural. Funds hedge portfolios with puts and few buy calls for that reason, so the 90 put can show 34% implied volatility while the 110 call shows 28%. The chain draws it as a smile tilted up on the left wing.
What should I check before holding an option for several days?
Days to expiry against your holding period, delta against the capital at risk, and the implied volatility you pay against the stock’s recent realized range. Then size from the full debit, since a long option can lose all of it. A 45-day call held ten days burns a quarter of its clock.
Can an options chain show what large traders are doing?
No. Open interest shows that contracts exist, not who holds them, and a print cannot tell you whether it opened or closed a position without trade-level data tagging the aggressor. Dealer positioning is an estimate built from open interest plus an assumption about which side dealers take.