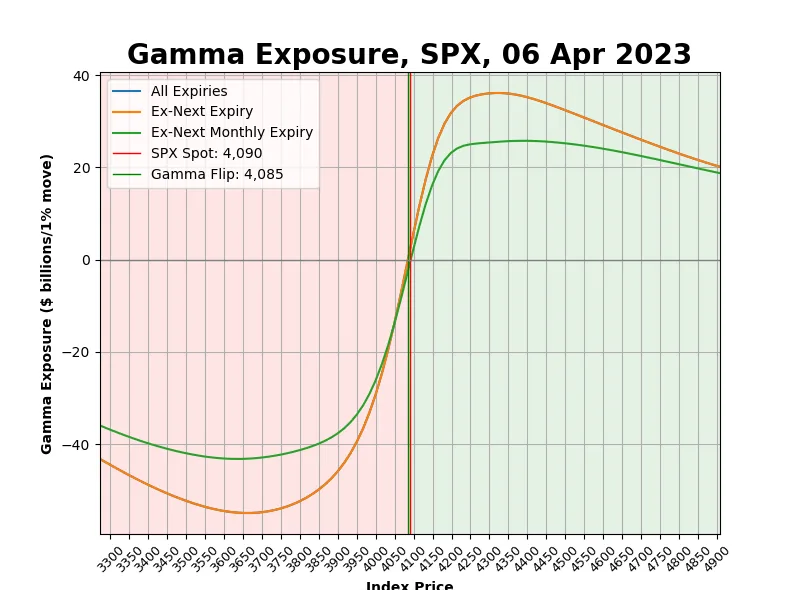
A dealer gamma number reads like an instrument reading. It is four numbers multiplied together, two of them straight from the option chain, one from a pricing model, and one from a guess about who is holding the contracts. You can rebuild a vendor’s headline figure in a spreadsheet in an afternoon, and you can disagree with their flip level by the evening.
The arithmetic is the easy half, and getting it exactly right is what makes the second half visible. Run it once by hand and the multipliers stop being mysterious; run it across a chain and the level where dealer hedging changes character becomes something you can place on your own chart.
The formula, term by term
For a single strike, the dollar value of dealer gamma is:
GEX per strike = gamma × open interest × 100 × spot squared × 0.01
- Gamma
- The change in delta per one-point move in the index, quoted per share by the pricing model the chain uses.
- Open interest
- Contracts still open at that strike, which is a different number from contracts traded there today.
- 100
- Shares delivered per contract.
- Spot squared × 0.01
- The dollar scale that turns a per-share delta change into dollars per one percent index move.
The last term carries the units. Gamma is quoted against a one-point move. One percent of 6,100 is 61 points, so gamma times 61 is the delta change per share across a one percent move, and one unit of delta is worth the spot price in dollars per index point. Gamma × 61 × 6,100 is the same product as gamma × spot squared × 0.01. One spot factor is the move measured in points; the other is the dollar value of a delta unit.
Multiply through and you have the dollars of delta a dealer has to trade to stay hedged when the index moves one percent, at that strike’s current open interest. What the total then does to intraday volatility is a separate question, covered in the gamma exposure explainer.
A worked example at five strikes
Spot at 6,100, five strikes $50 apart, with gammas and open interest shaped like an SPX chain: gamma peaks at the money and falls away into both wings, open interest clusters where traders concentrate.
| Strike | Gamma | Open interest | GEX ($ per 1% move) |
|---|---|---|---|
| 6,000 | 0.00011 | 4,200 | $17,191,020 |
| 6,050 | 0.00031 | 6,800 | $78,438,680 |
| 6,100 | 0.00042 | 9,500 | $148,467,900 |
| 6,150 | 0.00033 | 7,400 | $90,866,820 |
| 6,200 | 0.00009 | 3,600 | $12,056,040 |
Take the 6,100 row and run it in order. Gamma of 0.00042 times 9,500 contracts is 3.99. The 100 multiplier makes it 399. Spot squared is 6,100 × 6,100 = 37,210,000, and 0.01 of that is 372,100. Then 399 × 372,100 = 148,467,900 dollars per one percent move.
The five add to 17,191,020 + 78,438,680 + 148,467,900 + 90,866,820 + 12,056,040 = 347,020,460 dollars. The 6,100 strike alone carries 43 percent of that. The 6,200 strike, with 3,600 contracts open, carries 8 percent of the at-the-money row and 3.5 percent of the chain total, because its gamma of 0.00009 is roughly a fifth of the at-the-money value and the open interest is under half. Gamma decays faster with distance than open interest builds, and that is why a big open interest number on a wing strike is not automatically a wall.
Finding the gamma flip
Cumulative net gamma is a running total by strike, taken from the lowest strike upward. The flip is where the running total crosses zero: below it, dealer hedging is assumed to amplify moves; above it, hedging is assumed to damp them. The crossing is the number people quote, and it is the least reliable output of the whole calculation.
It almost never lands on a strike. Strikes sit 5 or 25 points apart, open interest is lumpy, and the running total steps at each strike rather than sliding through it. Between the two strikes that bracket the crossing, interpolate linearly: flip = lower strike + (absolute running total at lower ÷ (absolute at lower + absolute at upper)) × strike spacing. If the total is −$180,000,000 at 6,000 and +$40,000,000 at 6,050, the crossing is 6,000 + (180 ÷ 220) × 50 = 6,040.9.
The level moves for two reasons that have nothing to do with the arithmetic. Open interest changes overnight, so a flip built from Tuesday’s chain is not Wednesday’s. Intraday open interest is not published at all; vendors estimate it from volume, which stacks a second assumption on the first. Rebuild the flip after the close from settled open interest, and read any intraday version as an estimate with a wide band around it. If you would rather not rebuild it, the daily gamma levels page publishes the call wall, put wall, flip and volatility trigger from the same method.
Scaling across a whole chain
One strike demonstrates the arithmetic. The number quoted in public is the sum across every strike and both option types, and the sign convention is where the calculation stops being neutral. The common approach treats call open interest as positive dealer gamma and put open interest as negative: dealers are assumed to be short the calls customers sold them and short the puts customers bought from them.
Calls are the only rows in the five-strike sum, so the $347 million is a call-side total. Add the puts at the same strikes with the minus sign and the total falls, generally below zero at the lower strikes, which is what produces a flip at all.
Other conventions exist. Some tools assign the sign by whether the strike sits above or below spot rather than by option type, which is a proxy for the same customer-flow assumption. Others use volume-weighted intraday estimates and flip the sign at the money. Two sites can publish different flips for the same chain on the same morning and both can be internally consistent.
Expiry horizon is a second choice with the same kind of effect. A same-day expiry contributes gamma that dies at the close; a 60-day strike contributes less per contract but keeps contributing tomorrow. Folding every expiry into one figure weights a strike expiring this afternoon the same as one expiring in March, which buries how much of the hedge is concentrated in today’s expiry. The Options Viz tool lets you pick the expiries that go into the total, and the options guide covers how that choice interacts with the structure you are trading.
The assumption you cannot avoid
Open interest records that a contract exists and which side of it was created. It does not record who holds it now. A 6,100 call with 9,500 contracts open could be a dealer short against a fund’s long, or the exact reverse, and the chain shows the same row either way.
Nothing in the published data resolves this. The sign convention in the previous section is a belief about customer flow, and it holds often enough that the resulting levels are useful. Useful is not the same as correct.
When the belief is wrong at a strike, the error is not a rounding difference. That strike contributes to the total with the opposite sign, and if enough of the chain is signed the other way, the flip lands on the other side of spot. Because positive gamma damps hedging and negative gamma amplifies it, a wrong sign reverses the conclusion drawn from the same level: a market you expected to pin instead accelerates. The note on dealer positioning and price impacts works through that reversal with the same input data.
Every GEX figure you see, including the ones on this site, rests on one version of this assumption. Its practical value comes from a large share of the market watching a similar model. The model itself is a simplification of positions nobody can observe.
Checking your numbers
A full SPX chain reading is quoted in billions of dollars per one percent move. Five strikes at 6,100 gave $347 million; sixty strikes with open interest spread across them land in the low billions. A sheet reading a few million has lost a multiplier. One reading trillions has squared something that was already squared.
The 100 multiplier does not move the flip. Every strike scales by the same factor, so the crossing stays where it was and only the magnitude changes. That is what makes a missing 100 hard to spot: the level looks right and the size looks like a quiet market instead of a broken formula.
Gamma units are the other frequent error. Values around 0.00042 are per share. A vendor quoting 0.042 is per contract, and applying the 100 multiplier on top of that produces a figure a hundred times too large. Read the column header before you build anything on it.
Spot has to be the spot the chain is priced from. Running Monday’s sheet on Friday’s close assigns gammas from a different set of moneyness, so 6,100 is treated as at the money when it is 40 points away. Substituting the ES future for the index makes the same mistake quietly, because basis shifts every strike’s distance without changing a single label.
An at-the-money-only sheet is the last trap. Gamma peaks near the money, so three central strikes look like a fair sample of the chain. Walls sit where open interest is large and gamma is moderate, and the flip depends on the sign of the wings. A calculation over the middle three strikes is exactly right for those strikes and useless for the question you asked.