SPX Gamma Exposure: Dealer Positioning and Price Impacts
Net SPX gamma exposure reveals dealer positioning and how their hedging can act as support or resistance, shape price discovery, and affect volatility.
Options
Gamma exposure estimates how much index hedging the dealer book has to do as the S&P 500 moves. It is why some weeks compress into a range and others run.
Index hedging is mechanical, and the mechanics carry a number. Dealers who sold options hedge their delta every time spot moves, and the sum of that hedging demand across every strike and expiry is what gamma exposure estimates. It is the options-derived figure that maps most directly onto how wide a session trades and where price stalls.
Options Viz computes the reading from the live chain, and the same reading appears as a table on the gamma levels page before the open. The four strikes quoted alongside it deserve exact definitions, because each one implies a different reaction from the same hedging flow.
Scroll sideways to read the full diagram.
Gamma is the rate at which an option’s delta changes as spot moves. A 6,100 call carrying delta 0.52 and gamma 0.0012 per point gains roughly 0.12 of delta over a 100-point rally, so the hedge behind it has to add contracts as the move extends. One contract of that is trivial. Twenty thousand is a program.
Dealers hold both sides of a chain, and their book is the difference between what they bought and what they sold. Sum every index strike, weight each one by open interest, and the individual gammas collapse into a single figure: the number of deltas the dealer book must transact for a given move in spot. Vendors quote the result in dollars per 1% move, which turns the hedge into something comparable with your own position size. The earlier note on dealer positioning follows the same flow through the futures book.
Sign does most of the work. When the aggregate is net long gamma, staying hedged means selling index futures into rallies and buying them into weakness. When it is net short gamma, the same arithmetic runs the other way: the hedge buys strength and sells weakness. The level where the sum crosses zero is the gamma flip, and it is the most quoted number in this corner of the market.
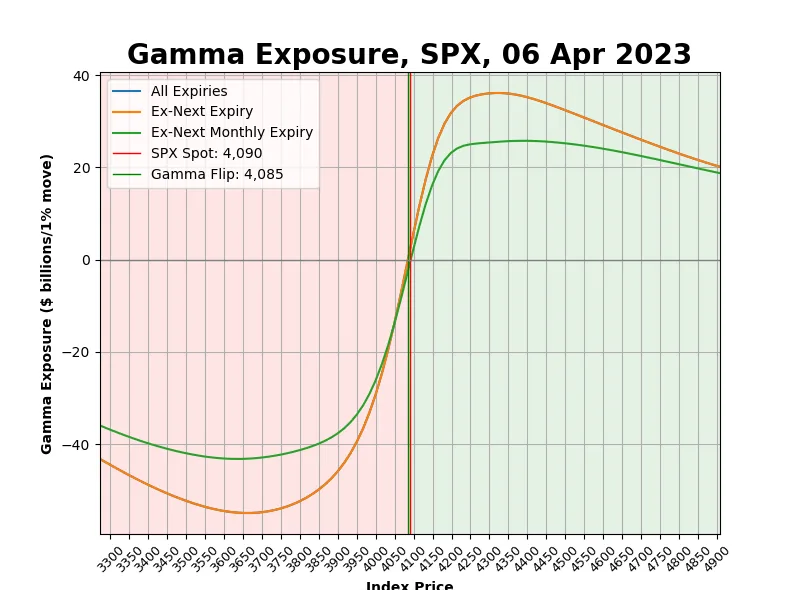
In the chart above the curve passes through zero between 6,050 and 6,100, and that crossing is the flip. Left of it the structure is short gamma, right of it long. Read the height as well as the sign: a reading only a little above zero buys little dampening, and a fast session can push it back through the crossing before the close.
Positive net gamma is a shock absorber bolted to the index. Every rally forces the hedge to sell, every dip forces it to buy, and the result is a session that grinds between strikes and rarely trends. Realized volatility falls, intraday ranges compress toward the strikes holding the most open interest, and a move that would run in a short-gamma tape stalls at the nearest wall.
Negative net gamma reverses the flow, and the effect grows with distance travelled. The hedge sells into weakness, which is extra supply at the moment buyers have stepped away, so a 40-point decline produces the next 40 points faster than the first. Weeks with heavy put open interest below spot sit in this regime often, and the afternoon tape shows which one you are in without any number at all.
Stop distance is where the sign changes your position. A 15-point stop on SPX, about a quarter of a percent, survives a positive-gamma session and gets run by noise in a negative-gamma one, because the floor under normal fluctuation is wider. The honest adjustment is to widen the stop and cut contracts until the dollar risk is unchanged. Keep the stop and the regime takes you out of a trade that was right on direction.
Four levels get quoted with every reading, and each implies different behavior. Two are strikes where open interest piles up, one is a sign change, and one is a threshold where the hedging flow becomes the largest order in the book.
Rallies decelerate into the strike holding the most call gamma, and the effect looks like a series of failed pushes through the same round number. On a daily chart it reads as a ceiling that takes two or three sessions to clear. Once spot is above it, that gamma has decayed and the level often holds as support on a retest.
Put gamma is largest where the most puts sit, so the selling implied by the hedge peaks at the strike itself. Selloffs slow into it and often pin there into the close. A break below turns the same flow into an accelerant, which is why the level gets watched as a trigger as much as a support line.
Days that open above the flip and stay there look like range days: the opening drive fails, the middle of the range holds, the close lands near it. A move through the flip changes the character of the tape inside the session, and the change shows in the width of the next hour’s bars before it shows anywhere else.
Below the trigger the index behaves like a different market. Ranges widen and the average true range over the following days climbs. Gaps fill less often. Above it the tape narrows again and extremes get faded without much follow-through.
Two inputs produce every reading. Open interest comes from the option chain and reports how many contracts exist at each strike and expiry. Gamma comes from a pricing model run on each of those contracts at the implied volatility the chain is trading. Multiply gamma by open interest, by the 100-share multiplier, by spot squared and by 0.01, and you have the dollar hedge for a 1% move at that strike. Sum the strikes for the aggregate. The per-strike calculation works through five strikes with the arithmetic laid out.
The dealer side is assumed, never observed. Open interest records that a contract exists; it does not record who holds it or which way they are positioned, so every vendor imposes a sign convention. The common one treats dealers as long the calls and short the puts, on the working belief that customers buy puts for protection and sell calls for income. Applied across a chain, that one assumption decides whether a strike contributes positive gamma or negative gamma to the total.
A strike carrying 40,000 contracts could be a fund holding calls outright, or one leg of a spread booked somewhere else. Each produces a different dealer sign. Get the convention wrong and the aggregate flips sign, which inverts positive and negative gamma and moves the flip to the other side of spot. Every level downstream inherits the error.
Options Viz computes the reading from whatever chain you load, so the convention can be tested against tape. Compare the flip it produces with where the index actually turned that day. The sessions where they disagree teach you more than the ones where they line up.
None of the four levels is a forecast. Gamma exposure describes how the tape behaves once it moves, and it says nothing about direction, timing or size. A deep negative reading is compatible with a flat session and with a 2% decline, and treating it as a bearish signal is the most common way the number gets misused.
The counterparty stays invisible. The convention assigns a dealer sign to every strike at once, while the real book has customers holding both sides at the same time. One fund hedging a large position can dominate a single strike, and nothing in the open-interest file distinguishes that from ten thousand small traders.
Walls are concentrations of open interest. They get consumed when a large trade lifts them, and they expire: the strike that held the index twice last week can lose its gamma entirely on the third Friday. The reading also does not transfer to single stocks. An index averages thousands of books into something that behaves like a dealer position, while one name is often one holder, and an earnings gap replaces the hedging story with an entirely different one.
The number drifts during the day. Open interest settles after the close, so a published reading describes yesterday’s book, and the short-dated contracts that move it most can be opened and closed inside one session without ever appearing in it. By the afternoon the figure you are quoting can describe a regime two steps away from the one you are trading.
Stops are the first thing the levels change. Long an index position with the put wall at 6,050, a stop at 6,045 sits inside the zone where hedging supplies the most futures, which is the worst fill of the session. Place the stop beyond the wall and cut contracts until the dollar risk matches, or accept a fill well past the line on the chart. The risk management guide has the sizing arithmetic.
Profit-taking works the other way. A long that has run into the call wall has reached the strike where hedge selling is heaviest, and the next 20 points take more buying than the previous 20 did. Sending part of the position out there gives up the tail of an extended move and improves the average if the wall holds.
When spot sits within half a percent of the flip, cut size. The reading can change sign on an ordinary afternoon, and a position built for a damped range is the wrong shape for an amplified one. Halving the contracts keeps the thesis and removes the part of the risk you cannot observe.
The volatility trigger is the cleanest regime switch available, because it is a level you can write into a plan before the open. Above it, wider stops and smaller size. Below it, expect the session range to open up and treat breaks as more likely to follow through. None of this improves a chart pattern’s hit rate. It changes the distribution of what happens after you are in, which is the part a stop and a size are meant to handle. The options guide covers how the chain itself is quoted if you want the reading taken from your own strikes.
It measures how much delta the dealer book has to trade for a given move in spot, summed across every index strike and weighted by open interest. The result is usually quoted in dollars of hedge per 1% move. It describes the mechanics of hedging around the current price and carries no view on where the index goes next.
Positive net gamma damps realized volatility, because the hedge sells into rallies and buys into dips, so ranges compress toward the strikes holding the most open interest. Negative net gamma amplifies it, because the same hedge adds supply into weakness and demand into strength. The effect grows the further spot travels from the flip.
The strike carrying the largest concentration of positive gamma, nearly always the one with the heaviest call open interest. Hedge selling peaks there, so rallies tend to decelerate into it. Once spot moves far enough above the strike for that gamma to decay, the level frequently holds as support on a retest.
The index level where aggregate dealer gamma changes sign. Above it the book is net long gamma and absorbs moves; below it the book is net short and extends them. It is read as a regime marker rather than a price target, since the reading can cross back during a session.
Open interest shows that contracts exist, not who holds them or which way they are positioned. Vendors assume a sign convention, most often dealers long calls and short puts, based on typical customer flow. A wrong convention flips the sign of the aggregate and puts the gamma flip on the wrong side of spot.
Poorly. The index reading averages thousands of separate books into something that behaves like one dealer position. In a single name one large holder can dominate the open interest at a strike, and an earnings gap replaces hedging flow with a repricing. Use it on index products and treat single-stock versions with suspicion.
They change stops, targets and size. Place stops outside the put wall rather than inside the zone where hedge selling peaks, take partial profit into the call wall, and cut contracts when spot trades near the flip. Treat the volatility trigger as a switch between wide-range and narrow-range conditions.
Net SPX gamma exposure reveals dealer positioning and how their hedging can act as support or resistance, shape price discovery, and affect volatility.
Gamma exposure per strike is gamma times open interest times 100 times spot squared times 0.01. Work it through five SPX strikes and read the gamma flip.
SPX 0DTE trading dynamics have shifted as traders sell at-the-money puts to fund near-the-money call buying, while institutions now ladder up their strikes.
Market makers hedge SPX options delta exposure with E-mini S&P 500 futures, and their dynamic rebalancing can influence price discovery in ES contracts.
Options give buyers the right, not the obligation, to buy or sell an asset at a set price. Basics cover calls, puts, strike prices, premiums and payoff.
Instead of long calls or puts, options spreads cut risk and debit cost while adding flexibility, with vertical, calendar, and diagonal structures explained.
Trade ideas, cutting edge indicators, live futures streams, real-time market news and a community of traders who share what they learn.